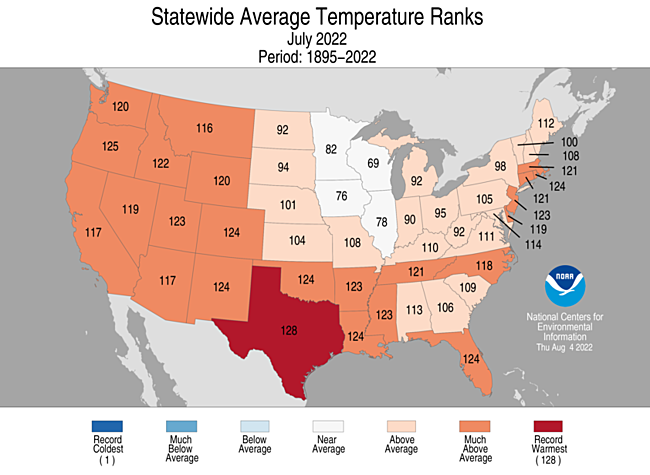
Climate change is driving rising temperatures and more record heat. The Earth’s temperature has climbed each decade since 1880 by about .14 degrees Fahrenheit, or roughly 2 degrees Fahrenheit total.
Stacker compiled a ranking of the hottest Mays in New York since 1895 using data from the National Centers for Environmental Information. Rankings are based on the highest average temperature in each month. For each of the hottest months listed below, we’ve included the average state temperature, state-wide highs and lows for the month, and the total precipitation.
#9. May 1975 (tie) – Average temperature: 59.6°F – Monthly high temperature: 72.2°F – Monthly low temperature: 47°F – Total precipitation: 3.15″
#9. May 1896 (tie) – Average temperature: 59.6°F – Monthly high temperature: 71°F – Monthly low temperature: 48.1°F – Total precipitation: 2.54″
#6. May 2024 (tie) – Average temperature: 60°F – Monthly high temperature: 70.9°F – Monthly low temperature: 49.2°F – Total precipitation: 3.53″
#6. May 2018 (tie) – Average temperature: 60°F – Monthly high temperature: 72.3°F – Monthly low temperature: 47.8°F – Total precipitation: 2.76″
#6. May 1991 (tie) – Average temperature: 60°F – Monthly high temperature: 72.2°F – Monthly low temperature: 47.8°F – Total precipitation: 3.21″
#5. May 1998 – Average temperature: 60.4°F – Monthly high temperature: 72°F – Monthly low temperature: 48.8°F – Total precipitation: 3.59″
#3. May 2012 (tie) – Average temperature: 60.5°F – Monthly high temperature: 72°F – Monthly low temperature: 49°F – Total precipitation: 4.12″
#3. May 1944 (tie) – Average temperature: 60.5°F – Monthly high temperature: 73.4°F – Monthly low temperature: 47.6°F – Total precipitation: 2.93″
#2. May 2015 – Average temperature: 61°F – Monthly high temperature: 74.2°F – Monthly low temperature: 47.8°F – Total precipitation: 2.75″
#1. May 1911 – Average temperature: 61.3°F – Monthly high temperature: 74.6°F – Monthly low temperature: 48°F – Total precipitation: 2.44″