Mediabistro Logo Mediabistro Logo
  • Jobs
    Search Creative Jobs Hot Jobs Remote Media Jobs Create Job Alerts
    Job Categories
    Creative & Design Marketing & Communications Operations & Strategy Production Sales & Business Development Writing & Editing
    Quick Links
    Search All Jobs Remote Jobs Create Job Alerts
  • Career Resources
    Career Advice & Articles Media Industry News Media Career Interviews Creative Tools Resume Writing Services Interview Coaching Job Market Insights Member Profiles
  • Mediabistro Membership
    Membership Overview How to Pitch (Premium Tool) Editorial Calendars (Premium Access) Courses & Training Programs Membership FAQ
  • Log In
Post Jobs
Mediabistro Logo Mediabistro Logo
Search Creative Jobs Hot Jobs Remote Media Jobs Create Job Alerts
Job Categories
Creative & Design Marketing & Communications Operations & Strategy Production Sales & Business Development Writing & Editing
Quick Links
Search All Jobs Remote Jobs Create Job Alerts
Career Advice & Articles Media Industry News Media Career Interviews Creative Tools Resume Writing Services Interview Coaching Job Market Insights Member Profiles
Membership Overview How to Pitch (Premium Tool) Editorial Calendars (Premium Access) Courses & Training Programs Membership FAQ
Log In
Post Jobs
Log In | Sign Up

Follow Us!

NYC

Highest-rated Class of 2026 women's basketball recruits from New York

Highest-rated Class of 2026 women's basketball recruits from New York
By Stacker Feed
2 min read • Published March 13, 2026
By Stacker Feed
2 min read • Published March 13, 2026

matimix // Shutterstock

Highest-rated Class of 2026 women’s basketball recruits from New York

The college basketball recruiting class of 2026 is packed with elite talent, featuring a deep pool of skilled guards, versatile wings, and dominant centers. Top programs like UConn, Baylor, and South Carolina battled for commitments from the nation’s best prospects, many of whom have showcased their abilities on the AAU circuit and in national events. With NIL deals playing an increasing role in recruiting, players are weighing not just coaching and development but also financial opportunities.

Stacker compiled a list of the highest rated Class of 2026 women’s basketball recruits from New York and nationwide using data from 247Sports. Athletes are ranked by their 247Sports Composite ranking. Data is as of March 12, 2026.

Highest-rated New York recruits

#7. Zaniyah Williams (PG)
– National rank: #64 (4 stars)
– Position rank: #8
– College: Auburn
– High school: Long Island Lutheran (Chesapeake, VA)

#6. Emily McDonald (CG)
– National rank: #40 (5 stars)
– Position rank: #2
– College: Kentucky
– High school: Long Island Lutheran (Glen Head, NY)

#5. Julia Scott (PF)
– National rank: #38 (5 stars)
– Position rank: #11
– College: Clemson
– High school: Albertus Magnus (Nanuet, NY)

#4. Sanai Green (SF)
– National rank: #32 (5 stars)
– Position rank: #7
– College: Duke
– High school: Long Island Lutheran (Glen Head, NY)

#3. Olivia Jones (SG)
– National rank: #21 (5 stars)
– Position rank: #3
– College: Vanderbilt
– High school: Long Island Lutheran (Glen Head, NY)

#2. Savvy Swords (SF)
– National rank: #17 (5 stars)
– Position rank: #4
– College: Kentucky
– High school: Long Island Lutheran (Glen Head, NY)

#1. Olivia Vukosa (C)
– National rank: #4 (5 stars)
– Position rank: #1
– College: UConn
– High school: Christ the King (Middle Village, NY)

Highest-rated national recruits

#10. Jacy Abii (PF)
– Position rank: #4
– College: Notre Dame
– High school: Frisco Liberty (Frisco, TX)

#9. Addison Bjorn (SF)
– Position rank: #2
– College: Texas
– High school: Park Hill South (Riverside, MO)

#8. Bri Crittendon (PF)
– Position rank: #3
– College: Texas
– High school: Riverdale Ridge (Thornton, CO)

#7. Trinity Jones (SG)
– Position rank: #2
– College: Clemson
– High school: Bolingbrook (Bolingbrook, IL)

#6. McKenna Woliczko (PF)
– Position rank: #2
– College: Iowa
– High school: Archbishop Mitty (San Jose, CA)

#5. Oliviyah Edwards (PF)
– Position rank: #1
– College: Tennessee
– High school: Elite Sports Academy (Tacoma, WA)

#4. Olivia Vukosa (C)
– Position rank: #1
– College: UConn
– High school: Christ the King (Middle Village, NY)

#3. Jerzy Robinson (SG)
– Position rank: #1
– College: South Carolina
– High school: Sierra Canyon (Chatsworth, CA)

#2. Kate Harpring (PG)
– Position rank: #1
– College: North Carolina
– High school: Marist School (Atlanta, GA)

#1. Saniyah Hall (SF)
– Position rank: #1
– College: USC
– High school: SPIRE Academy (Geneva, OH)

Topics:

NYC
LA

Highest-rated Class of 2026 women's basketball recruits from California

Highest-rated Class of 2026 women's basketball recruits from California
By Stacker Feed
2 min read • Published March 13, 2026
By Stacker Feed
2 min read • Published March 13, 2026

matimix // Shutterstock

Highest-rated Class of 2026 women’s basketball recruits from California

The college basketball recruiting class of 2026 is packed with elite talent, featuring a deep pool of skilled guards, versatile wings, and dominant centers. Top programs like UConn, Baylor, and South Carolina battled for commitments from the nation’s best prospects, many of whom have showcased their abilities on the AAU circuit and in national events. With NIL deals playing an increasing role in recruiting, players are weighing not just coaching and development but also financial opportunities.

Stacker compiled a list of the highest rated Class of 2026 women’s basketball recruits from California and nationwide using data from 247Sports. Athletes are ranked by their 247Sports Composite ranking. Data is as of March 12, 2026.

Highest-rated California recruits

#10. Devin Cosgriff (SG)
– National rank: #79 (4 stars)
– Position rank: #15
– College: Michigan
– High school: Archbishop Mitty (Oakland, CA)

#9. Jhai Johnson (PF)
– National rank: #61 (4 stars)
– Position rank: #17
– College: Vanderbilt
– High school: Oakland Technical (Oakland, CA)

#8. Amalia Holguin (SG)
– National rank: #58 (4 stars)
– Position rank: #12
– College: Texas
– High school: Sage Hill School (Newport Coast, CA)

#7. Arynn Finley (SG)
– National rank: #56 (4 stars)
– Position rank: #10
– College: Florida
– High school: Etiwanda (Rancho Cucamonga, CA)

#6. Karisma Lewis (SG)
– National rank: #49 (4 stars)
– Position rank: #8
– College: UC Santa Barbara
– High school: Buena (Ventura, CA)

#5. Kaeli Wynn (PF)
– National rank: #42 (5 stars)
– Position rank: #12
– College: South Carolina
– High school: Mater Dei (Santa Ana, CA)

#4. Cydnee Bryant (C)
– National rank: #35 (5 stars)
– Position rank: #7
– College: Kansas
– High school: Centennial (Corona, CA)

#3. Emilia Krstevski (C)
– National rank: #29 (5 stars)
– Position rank: #4
– College: Oregon
– High school: Sierra Canyon (Chatsworth, CA)

#2. McKenna Woliczko (PF)
– National rank: #6 (5 stars)
– Position rank: #2
– College: Iowa
– High school: Archbishop Mitty (San Jose, CA)

#1. Jerzy Robinson (SG)
– National rank: #3 (5 stars)
– Position rank: #1
– College: South Carolina
– High school: Sierra Canyon (Chatsworth, CA)

Highest-rated national recruits

#10. Jacy Abii (PF)
– Position rank: #4
– College: Notre Dame
– High school: Frisco Liberty (Frisco, TX)

#9. Addison Bjorn (SF)
– Position rank: #2
– College: Texas
– High school: Park Hill South (Riverside, MO)

#8. Bri Crittendon (PF)
– Position rank: #3
– College: Texas
– High school: Riverdale Ridge (Thornton, CO)

#7. Trinity Jones (SG)
– Position rank: #2
– College: Clemson
– High school: Bolingbrook (Bolingbrook, IL)

#6. McKenna Woliczko (PF)
– Position rank: #2
– College: Iowa
– High school: Archbishop Mitty (San Jose, CA)

#5. Oliviyah Edwards (PF)
– Position rank: #1
– College: Tennessee
– High school: Elite Sports Academy (Tacoma, WA)

#4. Olivia Vukosa (C)
– Position rank: #1
– College: UConn
– High school: Christ the King (Middle Village, NY)

#3. Jerzy Robinson (SG)
– Position rank: #1
– College: South Carolina
– High school: Sierra Canyon (Chatsworth, CA)

#2. Kate Harpring (PG)
– Position rank: #1
– College: North Carolina
– High school: Marist School (Atlanta, GA)

#1. Saniyah Hall (SF)
– Position rank: #1
– College: USC
– High school: SPIRE Academy (Geneva, OH)

Topics:

LA
media-news

Ready Set Fund Grow Releases White Paper Revealing How Targeted Urban Areas and Opportunity Zones Can Generate Institutional-Quality Returns Through Micro Data Center Infrastructure

By Media News
3 min read • Published March 13, 2026
By Media News
3 min read • Published March 13, 2026

New Research Quantifies the $100 Billion Opportunity Zone Capital Gap – and the Infrastructure Category Built to Fill It

HOMESTEAD, FL / ACCESS Newswire / March 13, 2026 / Ready Set Fund Grow (RSFG), a Farrington Capital Group, LLC initiative, today announced the release of its inaugural white paper, "How Targeted Urban Areas and Opportunity Zones Can Achieve Transformational Economic Returns Through Ready Set Fund Grow Micro Data Centers." The white paper is now available to accredited investors and economic development professionals upon request.

The white paper presents a data-driven case that micro data centers – purpose-built edge computing facilities deployed inside federally designated Targeted Urban Areas (TUA) and Opportunity Zone communities – represent the single highest-leverage infrastructure investment available to these communities, offering investors the rare combination of institutional-quality returns and genuine, measurable community impact.

"One hundred billion dollars has flowed into Qualified Opportunity Funds since 2017. The vast majority has gone to multifamily housing in already-gentrifying neighborhoods. The communities that need it most – communities like Homestead, Florida, where we built our flagship facility – have received almost none of it. This white paper shows exactly why that needs to change, and exactly what the numbers look like when it does."

– Alfred Farrington II, Founder & Managing Director, Ready Set Fund Grow

KEY FINDINGS OF THE WHITE PAPER:

The One Big Beautiful Bill Act of 2025 made Opportunity Zones a permanent feature of the federal tax code with a new round of designations in 2026 – creating an unprecedented window for infrastructure-anchored OZ investment

A $500,000 QOF investment in an RSFG facility held for 10 years generates an estimated $1,000,000-$1,350,000 in after-tax returns, with zero federal capital gains tax on appreciation after the 10-year hold

A single RSFG facility in a TUA/OZ community can leverage $725,000 to $1,600,000 in non-dilutive grant capital over five years – reducing the effective cost of capital by 40-50%

Every $1 of federal CDBG or EDA grant invested in an RSFG facility generates an estimated $2.50-$3.50 in local community economic activity

A five-facility RSFG network is projected to generate $10-$14 million in annual community economic impact at Year 5 and create 40-70 direct and indirect jobs

A $5,000,000 Qualified Opportunity Fund portfolio across five RSFG facilities projects a 3.2x base-case net return multiple with zero tax on appreciation after a 10-year hold

The white paper draws on data from the U.S. Chamber of Commerce Technology Engagement Center, the Economic Innovation Group, the Joint Committee on Taxation, PwC, MarketsandMarkets, and the U.S. Department of Housing and Urban Development.

Ready Set Fund Grow operates the flagship "The Fish Bowl" micro data center in Homestead, Florida – a 10-rack, 80kW edge computing facility offering HIPAA, SOC 2, and PCI-DSS compliant colocation to small and mid-sized businesses in South Miami-Dade County. The facility is paired with a coworking incubator, virtual office hub, and EV charging station, generating four independent revenue streams within the federally designated Targeted Urban Area.

The white paper is available to accredited investors, community development financial institutions (CDFIs), economic development organizations, and government agency partners. To request a copy, contact Ready Set Fund Grow directly.

ABOUT READY SET FUND GROW

Ready Set Fund Grow is a Farrington Capital Group, LLC initiative founded by Alfred Farrington II, a Homestead, Florida-based entrepreneur with expertise in blockchain technology, business development, investor relations, and digital infrastructure. RSFG operates The Fish Bowl micro data center in Homestead, FL and is pursuing expansion into additional TUA and Opportunity Zone markets nationwide. The ReadySetFundGrow Foundation (501(c)(3) application pending) serves as the non-profit grant-funding arm of the venture.

Securities are offered exclusively pursuant to Regulation D Rule 506(c) to verified accredited investors only. This press release does not constitute an offer to sell or solicitation to purchase securities.

###

Contact Information

Stuart Fine
CEO
stuart@remergify.com

Investors and Government Officials
Alfred Farrington II
CEO
alfred@farringtoncapitalgroup.com

SOURCE: Remergify, Inc.

View the original press release on ACCESS Newswire

Topics:

media-news
Careers & Education

How to define absenteeism and stop it from becoming a bigger problem

How to define absenteeism and stop it from becoming a bigger problem
By Hayden Goethe for Spring Health
5 min read • Originally published March 12, 2026 / Updated March 13, 2026
By Hayden Goethe for Spring Health
5 min read • Originally published March 12, 2026 / Updated March 13, 2026

A tired employee looking though a paperwork in the office.

Wasana Kunpol // Shutterstock

How to define absenteeism and stop it from becoming a bigger problem

When employees aren’t well or juggling too much, elevated rates of absenteeism are one signal for organizations to look for. And that signal comes at a cost for organizations. The CDC reports that cost is $1,685 per employee per year. For an organization with 600 employees, absenteeism costs would exceed $1 million annually. That’s why it’s essential to define absenteeism, so organizations can see what’s driving it and address those factors before it becomes a bigger (and more expensive) issue.

Spring Health explains how to define absenteeism, calculate your organization’s rate, and take steps to address it.

How to define absenteeism

Absenteeism refers to frequent or prolonged absence from work, often beyond what is considered normal or acceptable. While occasional absences due to illness or emergencies are expected, consistent absenteeism can signal underlying challenges such as stress, burnout, or unmet mental health needs.

High levels of absenteeism can affect workplace productivity, team morale, and overall organizational performance.

Is absenteeism on the rise?

Absentee rates in the U.S. have been stubbornly high since the COVID-19 pandemic. In 2019, the Bureau of Labor Statistics (BLS) reported a workplace absence rate of 2.8%. In 2024, that number had reached 3.2%. In some sectors, such as healthcare support and social services, the rate is well over 4%.

An important note: The BLS absence rates only include time missed for illness, injury, or childcare challenges—not time off for vacations, personal days, or holidays.

What is the difference between absence and absenteeism?

Generally speaking, an absence from work would include any type of reason for missing work. Absenteeism includes only consistent absences from work that are often unplanned or unusual, and these absences could be a sign of a chronic, underlying, or organizational problem.

What is an example of absenteeism?

A customer service manager at a large retail chain takes a three-week leave due to burnout. To fill the gap, the team rotates coverage across three other managers. While the department remains technically staffed, key performance indicators begin to decline, including:

  • Response times slow
  • Customer complaints increase
  • Team morale

Additionally, each replacement manager struggles to juggle their own duties with the added load.

According to SHRM, replacement workers are typically around 30% less productive than the employees they’re covering for, which means you’re not just paying more in labor, you’re getting less done. Multiply that across multiple departments and extended absences, and the cost of absenteeism becomes both a financial liability and a cultural risk.

What is the connection between employee mental health and absenteeism?

Physical and mental health are intertwined, so there can be a connection when absenteeism occurs due to illness, injury, medical problems, or child care problems. If an employee is missing work due to a chronic health condition, it may start to feel like too much. When absenteeism occurs outside an employee’s typical pattern, it could be a sign that their mental health is being impacted.

How do you calculate your absentee rate?

You can calculate your organization’s absentee rate with a couple of key data points:

  • Number of unexcused absences
  • Number of potential days of work during a time period

The formula you’d use to calculate the absentee rate is:

(Days of unexcused absences) / (Days eligible to work) x 100 = absentee rate

For example, Team A has five employees. Those employees had six unexcused absences in the month of October (which had 115 total eligible workdays across five employees), the absentee rate would be:

(6/115) x 100 = 5.2%

That rate is quite a bit higher than the national average and is probably worth a deeper dive.

What should your absentee rate be?

An ideal absentee rate is as close to zero as possible. But especially for large employers, there’s always going to be some amount of absenteeism. The current BLS rates, particularly within your industry, can serve as a benchmark for your organization.

7 tips to help you reduce absenteeism

If you’ve determined your absentee rates require attention, here are a few suggestions on how you can support employees in a way that drives down absenteeism and preserves organizational wellbeing and productivity:

Track types of absences
Not all time away from work signals the same challenge. Track and analyze patterns, like spikes in unplanned absences after stressful project cycles, or frequent Monday/Friday call-outs. This data can reveal whether absenteeism stems from burnout, job dissatisfaction, safety concerns, or deeper organizational issues.

Offer a modern mental health solution
Traditional EAPs are seeing declining relevance, with utilization often under 5%. Consider upgrading to an enhanced EAP that offers fast access, full-spectrum care, and proven outcomes. Employees are more likely to engage when they know the support is high-quality, confidential, personalized, and stigma-free.

Provide flexible work options
Rigid schedules can worsen absenteeism, especially for caregivers, neurodiverse employees, or those with chronic conditions. Consider hybrid or flexible scheduling to create breathing room. When employees have more control over how they work, they’re more likely to stay engaged. This is particularly true for your employees who are parents or caregivers.

Encourage PTO use
Burnout builds when time off is earned but unused. Encourage employees to actually take their paid time off—not just in response to exhaustion, but as proactive recovery. Normalize rest as a productivity strategy, not a privilege.

Keep employees engaged
Disengagement is one of the most common predictors of absenteeism. Make sure your employees feel their contributions matter, that their work is connected to purpose, and that recognition happens frequently. Low engagement often precedes physical absence.

Equip your managers to support others
Managers are your first line of defense against burnout, but many are burned out themselves. Equip them with training and resources to recognize early warning signs of distress, manage workloads compassionately, and foster a culture of psychological safety.

Review your safety protocols
Unaddressed workplace safety issues—whether physical, psychological, or environmental—can drive absenteeism. From ergonomic risks to workplace harassment, unresolved safety concerns often lead to avoidance behavior. Making sure your workplace is physically and emotionally safe can help minimize absenteeism.

This story was produced by Spring Health and reviewed and distributed by Stacker.

Topics:

Careers & Education
Careers & Education

The toughest jobs in the US include firefighter, cop and construction worker, poll finds

The toughest jobs in the US include firefighter, cop and construction worker, poll finds
By Richard Jenkins for Cat Footwear
2 min read • Originally published March 3, 2026 / Updated March 13, 2026
By Richard Jenkins for Cat Footwear
2 min read • Originally published March 3, 2026 / Updated March 13, 2026

A team of workers on a roadside construction site in New York.

18th Studio // Shutterstock

The toughest jobs in the US include firefighter, cop and construction worker, poll finds

The toughest jobs in the U.S. include firefighters, construction workers, and nurses.

A poll of 2,000 employed adults from Jan. 26 and Feb. 2 commissioned by Cat Footwear found 21 percent believe working in mining or oil is one of the most grueling jobs around, while 11 percent think being a doctor is a role only for the most resilient.

Others feel that only the iron-willed could be a roofer (10 percent) or a teacher (8 percent).

According to those polled, challenging jobs involve being on your feet all day (40 percent), working in all weather conditions (38 percent) and dealing with trauma or distressing situations (34 percent). Three-quarters (75 percent) of adults polled claimed that standing up all day can have serious repercussions for long-term health.

Below, Cat Footwear examines the physical demands of America’s toughest jobs and the toll they take on workers.

The study found those who work in construction, manufacturing and engineering spend an average of just under seven hours a day on their feet.

And people in healthcare and social services, such as nurses, will be on their feet for an average of six hours and eight minutes.

These workers also do more than 6,500 steps a day, with people working in environment, agriculture and sustainability doing a staggering 7,831 a day each on average.

Nearly 6 in 10 (57 percent) of all respondents went as far as to say sometimes, the single hardest part of their job is how much time they spend standing up.

And while 60 percent have felt pain in their feet after excessive standing, 59 percent claimed it causes back issues, while 11 percent even feel pain in their hands.

As many as 47 percent have turned down an invite or had to miss out because their body was too sore after a shift.

But 36 percent of respondents fear admitting their feet hurt would make them look “weak” in front of colleagues.

That includes 43 percent of men and 31 percent of women, according to the OnePoll.com data.

Toughest jobs in the U.S.:

Respondents were allowed to choose up to three options.

  1. Firefighter 26%
  2. Police officer 23%
  3. Construction worker 22%
  4. Miner/oil worker 21%
  5. Nurse 19%
  6. Paramedic 13%
  7. Agricultural/farm worker 11%
  8. Doctor 11%
  9. Roofer 10%
  10. Healthcare assistant/caregiver 10%

This story was produced by Cat Footwear and reviewed and distributed by Stacker.

Topics:

Careers & Education
Careers & Education

The access gap in trade school programs: How flexibility drives enrollment

The access gap in trade school programs: How flexibility drives enrollment
By John Haghani for Lumion
4 min read • Originally published February 12, 2026 / Updated March 13, 2026
By John Haghani for Lumion
4 min read • Originally published February 12, 2026 / Updated March 13, 2026

A group of female high school students participating in a skills trade workshop.

Harrison Ha // Shutterstock

The ‘access gap’ in trade school programs: How flexibility drives enrollment

The challenging economic climate has pushed more people toward trade schools in recent years, as reflected in the strong revenue growth at these institutions.

Despite the perception that trade school programs are more accessible and affordable than academic degrees, many would-be students are still held back by the cost of attending reputable programs.

As a result, vocational training providers are adopting flexibility as a core tenet of student tuition payment. Here, Lumion provides an overview of the impact on enrollment and what this means for the future of the trade school market.

The trend toward trade schools

The cost of college attendance has risen dramatically since the turn of the millennium, according to stats shared by Education Data Initiative. Tuition alone increased by 111.4% above the rate of wage inflation between 2000 and 2020, while the 25.6% rise in typical costs seen between 2013 and 2023 paints a similarly stark picture.

Combined with rapid upticks in living costs, it’s easy to understand why would-be students are less content with paying an average of $38,720 each year to attend a U.S. college. In this context, the attraction of trade schools is obvious.

From a pure price perspective, trade school programs cost as little as $5,000, according to Edvisors. Moreover, they take much less time to complete than a full four-year degree, meaning students can enter the job market and start earning sooner rather than later.

Avoiding student debt, which stood at $1.6 trillion as of June 2024, is another compelling reason for the growth of trade schools. It’s both a short-term and long-term advantage that makes sense for people from all backgrounds.

The flexibility factor

Lowering the barrier to trade school attendance remains a priority to increase enrollment and spur market growth, chiefly because even the prospect of paying a few thousand dollars for tuition and program materials is exclusory in certain demographics.

So schools that want to see a spike in student sign-ups are starting to adopt payment options that spread the cost over significantly longer periods, rather than requiring payment up front. This has notable repercussions according to the experts at trade school management platform Lumion, who cite a 25.1% boost in enrollment when flexible, longer-term payment options are made available to prospective students.

Industry data also shows that 90% of people aren’t aware of the earning potential of skilled trades, which might steer them away from trade schools, even though they could end up earning a salary that matches or exceeds roles made available to those with a bachelor’s degree.

Flexibility in this context comes in several forms. It covers not just repayment periods but also the repayment terms and the ways trade school attendees can pay. Keeping financing and loans in-house or with trusted partners helps schools both bolster enrollment and manage cash flow more consistently.

When unified with other strategies for attracting and converting leads, trade schools stand an even better chance of drawing prospects away from college courses that are beset by spiraling costs and diminishing employment prospects post-graduation.

The future implications and image issues

The next five years are expected to see continued growth for trade schools, according to data cited by the Education Writers Association (EWA). This includes a 6.6% annual increase in enrollment and a 6% bump in revenues every 12 months. Given that enrollment rates across the entire education sector are projected to be just 0.8% a year over the same period, it’s clear that trade schools are outperforming the broader sector.

While flexible payment is a driver of enrollment increases, there are still hurdles to overcome if this market is to remain buoyant for the foreseeable future. First, there’s the issue of job satisfaction in the blue-collar jobs that participants in trade school programs will enter once they have finished their studies. A Pew Research Center survey found that 43% of workers in this category would describe themselves as very or extremely satisfied with their profession, compared to 53% of white-collar workers.

The enduring stigma attached to skilled trades may be softening, but trade schools must continue to change the conversation and showcase exactly why it’s worth completing their programs for young people considering their careers today.

What’s next for trade school enrollment?

Trade schools are in a uniquely advantageous position at the moment due to a combination of external economic conditions and internal advantages like flexible payment solutions. They must make the most of this scenario in order to fulfill and ultimately exceed the projected growth figures from analysts.

The upshot for prospective attendees is that trade schools are closing the access gap, and it’s easier to justify enrolling in trade school programs that leave graduates with a highly employable, in-demand skill.

This story was produced by Lumion and reviewed and distributed by Stacker.

Topics:

Careers & Education
Careers & Education

15 graduation party invitation ideas

15 graduation party invitation ideas
By Jeff Preston for Grad Party Invites
4 min read • Originally published February 12, 2026 / Updated March 13, 2026
By Jeff Preston for Grad Party Invites
4 min read • Originally published February 12, 2026 / Updated March 13, 2026

Golden '2026' numbers in front of a stack of books and a graduation cap.

chayanuphol // Shutterstock

15 graduation party invitation ideas

Looking for creative ways to invite guests to your graduation celebration? Grad Party Invites has 15 inspiring invitation ideas that will set the perfect tone for your special day.

1. Classic Photo Invitation

Feature a professional graduation portrait as the centerpiece of your invitation. This timeless approach showcases your achievement and gives guests a beautiful keepsake. Choose a formal portrait or a candid moment that captures your personality.

2. Photo Collage Design

Tell your story through multiple photos spanning your academic journey. Include memorable moments, friendships, and milestones that led to this achievement. This nostalgic approach helps guests celebrate the full journey with you.

3. Minimalist Typography

Let clean, bold typography do the talking. A minimalist design with elegant fonts and simple color schemes creates a sophisticated, modern look. Perfect for graduates who appreciate understated elegance and contemporary design.

4. School Colors Theme

Incorporate your school’s colors throughout the invitation design. This shows pride in your institution while creating a cohesive look that guests will immediately recognize. Add school mascots or symbols for extra school spirit.

5. Floral Elegance

Soft floral designs add a touch of sophistication and natural beauty. Whether you choose watercolor flowers, botanical illustrations, or pressed-flower patterns, floral invitations bring an elegant, timeless quality to your announcement.

6. Gold Foil Accents

Add luxury with metallic gold foil details highlighting key information. Gold accents catch the light and create a premium feel that makes your invitation stand out. Perfect for formal celebrations and graduates who want to add glamour.

7. Vintage Style

Embrace retro charm with vintage-inspired designs featuring classic fonts, aged paper effects, and nostalgic color palettes. This timeless style works beautifully for both traditional and eclectic celebrations.

8. Modern Geometric Patterns

Contemporary geometric shapes and patterns create visual interest and a fresh, current aesthetic. Bold lines, abstract designs, and strategic use of negative space give your invitation a trendy, artistic edge.

9. Chalkboard Design

The chalkboard aesthetic brings a casual, handcrafted feel to your invitation. With hand-drawn elements and chalk-style typography, this design mimics the classroom experience in a charming, approachable way.

10. Confetti and Celebration Graphics

Embrace the festive spirit with confetti patterns, balloons, and celebratory graphics. This playful approach signals a fun, energetic party atmosphere and sets an upbeat tone for your celebration.

11. Elegant Formal Design

Traditional formal invitations with classic layouts, serif fonts, and sophisticated borders never go out of style. This approach works perfectly for formal dinner celebrations and dignified ceremonies.

12. Digital Animation

For digital invitations, consider adding subtle animations or GIF elements. Moving confetti, fading text, or animated graphics add a modern, tech-savvy touch that engages recipients and stands out in their inbox.

13. Before and After Photos

Create a fun side-by-side comparison showing your transformation throughout your academic journey. This lighthearted approach adds personality and humor while celebrating your growth and achievement.

14. Destination Theme

If you’re planning a destination celebration or outdoor event, reflect that in your invitation design. Beach themes, garden party aesthetics, or venue-specific elements help guests understand the celebration’s vibe and dress appropriately.

15. Custom Illustration

Commission or create custom illustrations that represent your interests, field of study, or future plans. Whether it’s artistic portraits, career-themed graphics, or hobby-inspired designs, custom illustrations make your invitation truly one-of-a-kind.

Choosing the Right Design for You

When selecting your graduation invitation design, consider these factors:

  • Party Style: Match your invitation design to your celebration’s formality level
  • Personal Style: Choose designs that reflect your personality and aesthetic preferences
  • Budget: Digital invitations offer beautiful designs at lower costs than printed options
  • Timeline: Digital invitations arrive instantly, while printed cards need shipping time
  • Guest List: Consider your audience and what design styles will resonate with them

Digital vs. Printed Invitations

Each format has unique advantages. Digital invitations are eco-friendly, cost-effective, and arrive instantly. They also allow for interactive elements like RSVP buttons and calendar integration. Printed invitations offer a tangible keepsake and work well for formal celebrations or when guests may not regularly check email.

Personalization Tips

Regardless of which design you choose, personalization makes your invitation special:

  • Include your graduation date and institution
  • Add party details: date, time, location, dress code
  • Incorporate personal photos or meaningful graphics
  • Choose colors that represent you or your school
  • Write a personal message or quote that reflects your journey
  • Include RSVP information and any special instructions

Final Thoughts

Your graduation party invitation is the first glimpse guests will have of your celebration. Whether you choose a classic photo design, modern minimalist style, or playful confetti theme, the most important thing is that it reflects you and sets the right tone for your special day. Don’t be afraid to mix elements from different ideas to create something uniquely yours!

This story was produced by Grad Party Invites and reviewed and distributed by Stacker.

Topics:

Careers & Education
Careers & Education

11 highest-paying construction jobs for independent contractors

11 highest-paying construction jobs for independent contractors
By Mary Beth Eastman for ERGO NEXT
7 min read • Originally published February 4, 2026 / Updated March 13, 2026
By Mary Beth Eastman for ERGO NEXT
7 min read • Originally published February 4, 2026 / Updated March 13, 2026

A specialist inside an elevator shaft to repair systems.

K-FK // Shutterstock

11 highest-paying construction jobs for independent contractors

According to the U.S. Bureau of Labor Statistics, employment opportunities in the construction field are expected to grow faster than average by 2034, and create 649,300 new jobs. The median salary for construction workers is $58,360 (as of May 2024), which is higher than the median wage for all occupations at $49,500.

If you’re an independent contractor working in construction and you want to increase your pay, or you are considering career opportunities in construction, ERGO NEXT has compiled the 11 construction jobs — from unskilled labor to specialized skills — with the highest pay potential.

Two things to note when you’re looking at this list:

  1. What you earn in your city or state may be higher or lower than what’s listed here, as these wages are based on national averages. Construction worker salaries can vary based on many factors, including your skill level, experience and your local job market.
  2. All of these jobs require a high school diploma or equivalent. None of them require a college degree. Many of them will also require you to complete an apprenticeship program before you can get to work.

1. Elevator and escalator installers and repairers ($106,580)

Those working in this field don’t just install, repair and perform routine maintenance. They also work on escalators, moving walkways and chair lifts. They’re responsible for ensuring the equipment is safe, working correctly and up to code.

Many states require elevator installers and repairers to have a license.

With a median salary of $106,580, elevator and escalator installers and repairers top our list of highest paying construction jobs nationwide. By 2034, opportunities are expected to grow by 5% — faster than the average of 3.1% expected for overall job growth.

But if you’re not comfortable in small spaces, this profession might not be your best bet. Elevator installers and repairs often work in small, enclosed areas, such as crawl spaces, machine rooms and elevator shafts.

It’s also important to consider that job opportunities can be limited in smaller communities without many multi-story buildings. But if you live within commuting distance of a major metro area, you’ll likely find more opportunities.

2. Boilermakers ($73,340)

Boilermakers install and repair boilers, vats and other large containers that hold liquid or gas. They test and inspect the machines to ensure they’re working correctly, clean the equipment, and repair and replace components.

Boilermakers often work at construction sites and may travel away from home for extended periods. It can also be physically demanding, and it’s sometimes necessary to work in cramped conditions.

While boilermakers earn a good living, job growth is projected to decline 2% in the next decade. However, there are still about 800 openings for this job projected each year on average.

3. Construction and building inspectors ($72,120)

Construction workers and building inspectors are some of the highest-paid contractors in the construction industry with a median salary of $72,120.

Many state and local authorities require construction and building inspectors to have a license or other certification. Professionals in these jobs monitor construction projects to ensure that buildings, streets, bridges, sewer systems and other structures are up to code. They make sure construction adheres to zoning regulations and meets the contract’s requirements. And they typically submit their findings to project stakeholders and regulatory agencies once the project is complete.

This isn’t the job for you if you’re just starting your career. Typically, this work requires several years of related work experience in the construction field. But if you’ve worked in the industry for a while, it could be a good opportunity for you to boost your earning potential.

Though there is expected to be a 1% decline in these roles over the next decade, 14,800 job openings are projected each year to fill vacancies left by workers who retire or switch to other roles.

4. Plumbers, pipefitters and steamfitters ($62,970)

These professionals install and repair pipes, fixtures and related systems that transport water, gas and additional materials through homes and commercial buildings. They also clean out drains to prevent back-ups and other issues.

Plumbers must be licensed and carry plumber insurance in most states. Many also attend vocational or trade school.

Employment for plumbers, pipefitters and steamfitters is expected to grow 4%, a little faster than average for all occupations. About 44,000 new jobs for plumbers, pipefitters and steamfitters are projected each year, on average.

5. Electricians ($62,350)

Electricians install and maintain the electrical systems, communications, lighting and control systems in residential and commercial buildings.

Most states require you to have an electrician license before you can work in this field. Together with electrician insurance, these are usually prerequisites to a successful career.

If you’re looking for a high-paying contract job with plenty of opportunities (approximately 81,000 openings projected yearly), this might be a good fit. From 2024-2034, the expected job growth for electricians is 9% — about three times the expected growth rate for all occupations.

6. Ironworkers ($61,940)

Ironworkers install iron and steel components during the construction of new buildings, roads, bridges and other structures. They also reinforce existing structures and assist with the demolition of older buildings.

This job can be physically demanding. It’s often required for workers to work at great heights. However, if you’re interested in getting into this line of work, you often only need a high school diploma to get started. And you can learn on the job or through an apprenticeship.

The construction of large projects such as high-rise buildings nationwide is expected to drive employment. Similarly, infrastructure maintenance and replacing of old buildings, roads and bridges will also likely contribute to job growth. From 2024-2034, ironworkers’ expected occupational growth is 4% — about average for all occupations.

7. Sheet metal workers ($60,850)

Sheet metal workers make or install products constructed from thin metal sheets, including steel, aluminum and alloyed metals.

They’re responsible for choosing the right type of sheet to use based on a construction job’s requirements. Projects they work on include heating and cooling ducts, outdoor pipes, gutters and flashing.

There won’t be as many opportunities for sheet metal workers compared to some of the other jobs on this list. Job growth in this profession is projected to be about 2% over the next decade, or about 10,600 jobs per year. However, almost every building requires sheet metal for ducts and other structural systems, so you might be able to find opportunities in your community.

8. Carpenters ($59,310)

Carpenters cut, shape, install and repair walls, floors, door frames and other structures made of wood, plastic, fiberglass and drywall.

Carpenters are an integral part of many construction projects, including bridges, commercial buildings, residential properties and more. Currently, employment opportunities for carpenters is projected to grow 4% from 2024 to 2034.

Some states require carpenters or anyone working in carpentry to carry a carpenters license before they work. And they are often required to carry carpenter insurance due to the risk of injury and property damage on the job.

9. Drywall installers, ceiling tile installers and tapers ($58,800)

Drywall and ceiling tile installers place drywall panels over walls and ceilings. These panels cover insulation, electrical wires and pipes and help dampen sound. Tapers prepare the drywall for finishing.

Like many construction-related jobs, the work can be physically demanding, and you need an eye for precision as you’re working on interiors. However, formal educational credentials are usually not required for this job, making it easier to enter for a beginner.

There is a 4% growth projected from 2024-2034 (about the same as the average for all jobs), with more than 8,800 openings for drywall contractors projected annually.

10. Construction equipment operators ($58,320)

We’ve all seen heavy equipment on job sites, such as excavators, bulldozers and backhoes. Construction equipment operators drive and control these and other types of machinery used to build structures, roads and buildings.

Operators can sometimes have irregular schedules; working at night is sometimes an essential for this profession. Job growth is expected to be 4% over the next ten years, which is about average for all occupations.

11. Masonry workers ($56,600)

What carpenters do with wood, masons do in stone. Masons use brick, block, stone and concrete to build structures. While they often work on buildings and foundations, their work encompasses much more. Masonry workers also build walkways and sidewalks, walls, and decorative finishes (including things like granite kitchen countertops and fireplaces).

Masonry workers typically learn their trade through apprenticeships and on-the-job training. Similarly, many technical schools offer masonry programs. Depending on the state where you work, you may be required to have a masonry license and mason insurance.

The demand for masons largely depends on overall demand for new buildings and road construction. Employment of masonry workers is projected to grow 2% through 2034, which is slower than average for all occupations. However, as brick and stone are very popular for interiors and exteriors, it’s likely that demand for this type of work will continue.

This story was produced by ERGO NEXT and reviewed and distributed by Stacker.

Topics:

Careers & Education
Careers & Education

As school choice programs grow, parents are demanding better customer service

As school choice programs grow, parents are demanding better customer service
By Linda Jacobson for The 74
5 min read • Originally published February 6, 2026 / Updated March 13, 2026
By Linda Jacobson for The 74
5 min read • Originally published February 6, 2026 / Updated March 13, 2026

Tennessee Gov. Bill Lee signed the Education Freedom Act in February. The private school choice program serves about 20,000 students this year, but he’s calling for further expansion.

Courtesy of the Tennessee Office of the Governor

As school choice programs grow, parents are demanding better customer service

As states continue to launch and expand private school choice programs, one of their biggest challenges is building online platforms that meet the overwhelming demand.

Tennessee families experienced a bottleneck earlier this year as they waited hours online to submit applications for the state’s new Education Freedom Scholarship program. In July, the state told 166 parents that they had received a scholarship, only to alert them a few days later that the notification was a mistake.

“It wasn’t the most ideal user experience,” said Heide Nesset, a senior fellow for the Beacon Center of Tennessee, a right-leaning think tank. But Nesset told The 74 there was a “tight runway,” about three months, to get the program off the ground.

With state leaders hoping to serve up to 70,000 students next year, they’re now searching for a new vendor. Proposals are due Friday.

But the rough start in Tennessee wasn’t an anomaly. All states with education savings accounts have struggled to some extent with ensuring smooth transactions for families, whether that’s paying a school on time or ordering a homeschool curriculum. Some say the solution lies in picking more than one company to handle the increasing demand and improve customer service.

“If it’s one contract, I think the vendor is inherently trying to ensure that the state department has a really fantastic experience,” said Nesset, who is also the vice president of implementation at the Yes. Every Kid. Foundation, a school choice advocacy organization. “If you have more than one [vendor], then they start competing, and families have the opportunity to make choices.”

Tennessee’s current vendor is Student First Technologies, which won a contract in 2023 to run a smaller ESA program in three counties. Earlier this year, the state expanded the contract with the Indiana-based company to manage the new statewide program, despite its problems in other states.

In West Virginia, where Student First still operates the Hope Scholarship program, an ESA, homeschool families complain that they can’t access the platform on their phones and that approvals and denials for purchases are inconsistent. Arkansas canceled its contract with Student First last fall after it failed to deliver a “fully operational” system on time. The company paid the state a $300,000 fine.

‘Get what they need’

Eighteen states now have at least one ESA program. With a new federal tax credit scholarship system beginning in 2027, the demand for organizations to manage them will surely grow. The trick is delivering a system that runs smoothly for families while ensuring that they’re using the money the way the state intended.

In a recent interview, Michael Horn, cofounder of the Clayton Christensen Institute, a think tank, talked with Jamie Rosenberg, the founder of ClassWallet. Still the biggest player in the market, the Florida-based company manages nine ESA programs.

Prior to platforms like his, states had two options, he explained. They either issued debit cards, which made it hard to ensure parents spent the money on allowable purchases, or expected them to pay up front and request reimbursement — a significant obstacle for families on a tight budget.

ESA vendors, he said, give families the “agency to get what they need but also the ease of knowing that what they’re doing and what they’re buying [complies with] program rules.”

Adding more than one vendor to the mix could make the companies work harder to reach lower-income and unrepresented families who are less likely to use the programs, said Lisa Snell, a senior fellow at Stand Together Trust, which funds school choice initiatives.

“Family outreach and satisfaction become the goal rather than the government as the customer to one vendor,” she said.

Texas had the option to choose multiple vendors for its new ESA program, which launches next fall. The law allows the comptroller’s office to contract with up to five companies. But officials opted against it and awarded a two-year, $26 million contract to New York-based Odyssey, which currently runs programs in four other states.

Joe Connor, Odyssey’s CEO, declined to comment on the state’s decision and referred The 74 to the state comptroller’s office. The office did not respond, but Amar Kumar, CEO of KaiPod Learning, a large national network of microschools, said the state likely felt multiple vendors would further complicate the process.

“There was this huge question of the complexity of doing that,” he said. “How do you tell families which portal to go to or how will they decide who manages which part of the program?”

‘Send a quarterly check’

The vendor platforms include built-in tools to prevent misuse. Student First Technologies has an AI feature, called QuinnIQ, that reviews each expense, “assigns a confidence score” and flags anything that’s new or that the state hasn’t approved in the past.

But Katie Switzer, a West Virginia parent using the state’s Hope Scholarship to homeschool her children, said it’s unreliable, sometimes approving purchases for some families and rejecting the same items for others. She thinks states should focus more on monitoring students’ academic progress than tracking every purchase.

“It’s stupid in my opinion to micromanage down to like the $20 workbook level,” she said. “Honestly, I think it would be more cost effective to send a quarterly check to families.”

That’s unlikely with such programs constantly under the microscope, and critics, especially in Arizona, pointing to high-end purchases, like diamonds and plane tickets, as examples of misuse. The state education department says it takes steps to prevent fraud and has referred cases to the attorney general’s office that have led to convictions.

West Virginia officials said they’re pleased with Student First’s progress since October, when parents complained that delayed orders caused students to fall behind on lessons. Orders are now “generally” processed within two business days, said Assistant Treasurer Carrie Hodousek, and the company has added and trained staff to prepare for peak order times.

Providers like KaiPod have their own concerns. School founders in the network have sometimes gone to the brink of eviction from their leased space because of late tuition payments, said CEO Kumar.

“There should be a predictable schedule, but sometimes it can take weeks extra to get paid,” he said. “If you’re running a small business and you owe rent, you owe payroll and your state payment is delayed, that creates a huge amount of stress for founders.”

For now, rebidding contracts for vendors is the strongest form of accountability, he said.

“They ought to not feel safe once they’ve won a contract,” he said.

Disclosure: Stand Together Trust provides financial support to The 74.

This story was produced by The 74 and reviewed and distributed by Stacker.

Topics:

Careers & Education
Careers & Education

11 numbers that capture the Trump effect on education

11 numbers that capture the Trump effect on education
By Sarah Butrymowicz for The Hechinger Report
9 min read • Originally published January 21, 2026 / Updated March 13, 2026
By Sarah Butrymowicz for The Hechinger Report
9 min read • Originally published January 21, 2026 / Updated March 13, 2026

: Protestors participating in a 'study-in' in front of the US Department of Education building on March 21, 2025 in Washington, D.C.

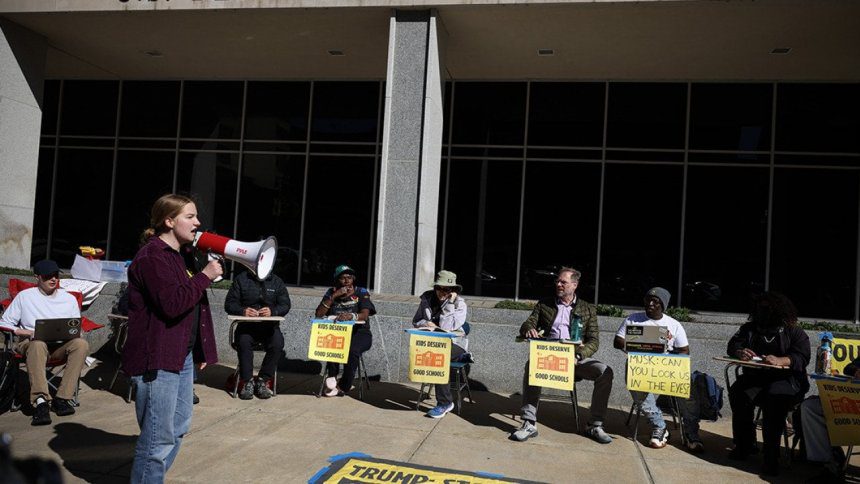
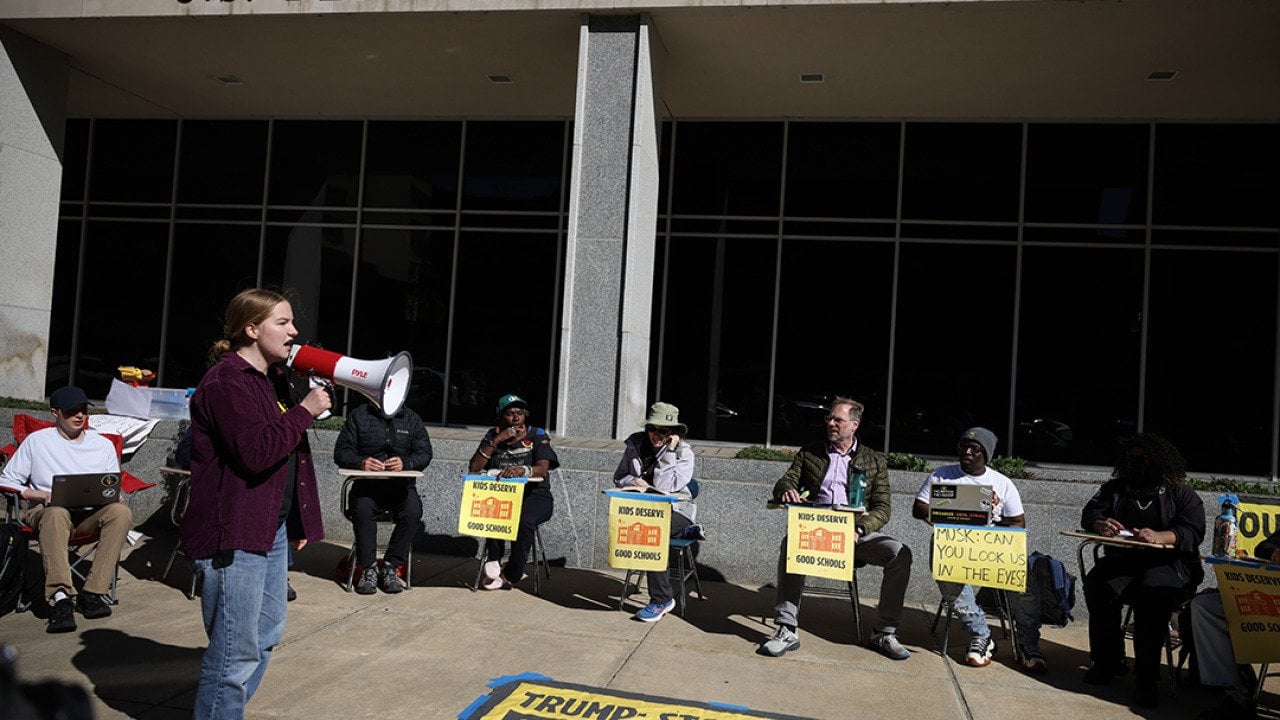
Kayla Bartkowski // Getty Images

11 numbers that capture the Trump effect on education

About 1.5 million people teach on college campuses in the United States, and nearly 4 million teachers work in its public elementary and secondary schools. More than 15 million undergraduates attend U.S. colleges and universities. There are more than 50 million school-age children across the country.

They all have one thing in common: Federal education policy affects their lives.

President Donald Trump and Education Secretary Linda McMahon say they want to close the Department of Education and return control of education to the states. At the same time, however, they have aggressively and rapidly wielded federal power over schools.

The Hechinger Report takes a look at some key data points from the first year of Trump’s second term that represent the outsized effect this presidency has had on the nation’s educational institutions and the people within them.

— 15 —

Number of executive orders Trump signed that exclusively address colleges or schools

In 2017, the first year of his first term, Trump signed two executive orders related to education. This year, he signed three times that number on just a single day in April.

Among his most notable executive orders was one early in his term requiring the Department of Education to begin dismantling itself. He also established an Artificial Intelligence Education Task Force and asked cabinet members to provide him with a plan to end “radical indoctrination” in schools. Other executive orders have addressed school discipline, transgender athletes, registered apprenticeships and foreign influence on college campuses.

Another set of executive orders indirectly affected schools. For instance, the Department of Education interpreted an order about undocumented immigrants to require limiting access to some adult and career and technical education programs. And separately, in a presidential memorandum, Trump ordered universities to begin reporting the race of their applicants and admitted students, not just those who enroll in the fall.

— 26 —

Number of investigations into K-12 transgender policies announced by the Education Department

At the K-12 level, the administration has given no issue more attention than policies that govern which bathrooms, locker rooms and sports teams transgender students can access. In all, the department has announced at least 26 such investigations, including into six state education agencies and three statewide athletic associations.

By comparison, the Trump administration announced eight investigations into antisemitism at elementary and secondary schools and four cases of alleged racial discrimination that hurts white teachers or students.

In higher education, it’s the inverse: Just five investigations into transgender issues have been announced, while dozens of cases of antisemitism and racial discrimination are being investigated.

— 50+ —

Number of education-specific lawsuits filed against the Trump administration

It’s not unusual for presidential administrations to be sued: Texas Attorney General Ken Paxton brags about suing the Biden administration 100 times. But the first year of Trump’s second term has been marked by unprecedented legal activity related to his administration’s education actions, according to a review of court documents and other lawsuit trackers. Trump, McMahon and the Department of Education have been sued over efforts to fire employees and dismantle the department, freeze funding and cancel grants, and end diversity, equity and inclusion efforts.

The administration’s track record defending itself in court has been mixed, but it scored a major victory when the Supreme Court allowed its March layoffs of hundreds of Education Department staffers. However, courts have blocked some efforts to ban diversity, equity and inclusion initiatives, forced the federal government to pay out some once-frozen grants and allowed Harvard to continue enrolling foreign students.

— 1,950 —

Number of employees who left the Department of Education in the spring

When Trump took office, the Education Department had more than 4,100 employees. Soon after, those numbers started dropping. In the first seven weeks of the new administration, 572 staffers voluntarily resigned. In March, 1,378 more employees were let go. Many offices were decimated without a clear plan for how or if their work would continue.

The National Center for Education Statistics, for example, went from about 100 staffers to three. That office is responsible for collecting data on the nation’s schools and colleges and administering the National Assessment of Educational Progress. Or take the Office for Civil Rights, which is in charge of investigating complaints about civil rights violations, including sexual harassment, racial discrimination and failure to provide an adequate education to students with disabilities. Seven of its 11 regional offices were shuttered and, in all, it lost nearly half its staff. (In December, some of those staffers were temporarily called back to help reduce a backlog of cases.)

The administration notified another 466 employees they were being let go during the government shutdown in October. Those positions were reinstated, however, as part of a congressional deal to reopen the government. The department also launched a plan to move large swathes of its work to other agencies, including the departments of Labor, State and Health and Human Services.

The Education Department did not respond to several requests for information about how many people are working at the agency now.

— 5 —

Number of regional Head Start offices closed

As part of the administration’s sweeping reductions in force, five out of 10 regional Head Start offices were abruptly closed and all employees fired in April. The offices, all in blue states, help oversee the free child care services provided by local early education programs for low-income children. In all, the five offices had been responsible for oversight of 318,000 — or 44% — of Head Start slots.

That wasn’t the only upheaval Head Start programs faced this year. At the end of January, the Trump administration directed agencies to temporarily freeze federal funding for thousands of financial assistance programs, including Head Start. Soon after, the White House said the program was exempt, and later it withdrew the order altogether. (A federal judge eventually ruled the entire directive was illegal.) But dozens of centers serving more than 20,000 children reported weeks-long delays in accessing federal money, with some forced to close temporarily. Then, during the government shutdown in the fall, centers serving 9,000 kids had to close their doors, some for several weeks, according to tracking by the First Five Years Fund.

— 17% —

Decline in new international student enrollment in fall 2025

The Trump administration’s attacks on foreign students with political views it disliked made international headlines this spring, as it targeted students protesting the Israel-Hamas war for deportation and announced plans to scour the social media accounts of new visa applicants. It also imposed travel restrictions and delayed some processing of student visas. The result is a slower pipeline of new foreign students coming to the United States, according to data from the Institute of International Education.

The decrease in new international students was driven by graduate students, whose enrollment declined most sharply. But because most returning students stuck with their U.S. education plans, the overall number of foreign students (including those engaged in jobs related to future or past higher education enrollment) ticked down just 1%. Still, that’s a big deal for colleges and universities: Graduate students make up the lion’s share of international enrollment and are a major source of revenue for many colleges. International students typically do not get financial aid, paying full price to attend.

— $1,700 —

Maximum tax break an individual can get for donating to school choice scholarships

Trump’s signature legislation, the One Big Beautiful Bill Act, was a major win for school choice advocates: It created a new federal school voucher program. The law sets up tax credit scholarships — vouchers — families can use to pay for private school tuition, tutoring or other educational expenses. Parents will also be able to use the money to cover homeschooling costs. Starting in 2027, individuals can get a tax credit of up to $1,700 for donations to nonprofits that provide the scholarships. Those nonprofits, in turn, will be in charge of handing out the money.

States must opt in if they want schools within their respective borders to be able to participate. At least three states so far have said they will decline, but more than 20 others have already established their own tax credit scholarship programs and are expected to sign up when the federal option becomes available.

— 6,353 —

Number of complaints the Education Department’s Office for Civil Rights dismissed between mid-March and mid-September

In one six-month stretch, the Department of Education’s Office for Civil Rights dismissed more than 6,000 complaints without an investigation, according to a September court filing. By contrast, the Biden administration did the same with 2,527 cases in its final three months.

The Trump administration has said in court filings it is following longstanding policies for dismissing cases. Former employees and advocates counter that the jump in dismissals suggests student and parent complaints are not being adequately probed, and that layoffs are affecting an agency that has long struggled to keep up with its caseload.

The rate at which the Trump administration reaches a final resolution in the cases it does investigate has significantly slowed. Between mid-March and mid-September, OCR resolved 581 complaints through mediated settlements, voluntary agreements or technical assistance. Another 138 were resolved after an investigation did not find evidence of violations. Those numbers are roughly the same as the last three months of the Biden administration (595 and 119 respectively).

— $153 million —

Amount of grant money the administration is spending to promote civics education

The Education Department said in September it gave more than $153 million to 85 grantees to work on civics education. That’s a major increase: Since this grant program launched in 2017, just 38 grants worth about $75 million had been awarded in all.

Promoting patriotic education is one of McMahon’s goals. “Patriotic education presents American history in a way that is accurate, honest, and inspiring,” her agency said in a September announcement prioritizing discretionary spending on this issue. “It emphasizes a unifying and uplifting portrayal of the nation’s founding ideals.”

McMahon also started the America 250 Civics Education Coalition, in preparation for next year’s anniversary of the signing of the Declaration of Independence. The coalition is made up largely of conservative organizations including Turning Point USA, Moms for Liberty, Hillsdale College and Priests for Life.

— $5.8 billion —

Minimum amount of federal research funding cut or frozen

Federal research dollars, many of which flow to colleges and universities, were cut way back this year. It’s difficult to calculate exactly how much was lost; this money comes from many agencies and some remains mired in legal battles. The website Grant Witness, run by a group of researchers, tracks canceled or frozen grants. Its data shows that more than $5.1 billion in National Institutes of Health money that had yet to be spent was earmarked for colleges or universities, as was nearly $700 million from the National Science Foundation. (Some of that funding may have been restored.)

Those agencies were two of the largest sources of federal grants to higher education, but not the only ones. More than $425 million in National Endowment for the Humanities grants, many of which are awarded to colleges, were canceled. (Those cuts were later found to be unlawful.) The Department of Agriculture canceled tens of millions of dollars in higher education research funding, and the Environmental Protection Agency also terminated such grants.

The picture doesn’t look better for year two of Trump’s term: The White House has proposed cutting all federal research funding by a third — a decrease of more than $33 billion from 2025.

— 0 —

Number of colleges that have signed the Trump ‘Compact for Academic Excellence in Higher Education’

The Trump administration has been aggressive in trying to bend higher education to its will. In October, officials reached out to nine universities, including some of the country’s most selective institutions, with a deal. The schools could be first in line for federal money if they agreed to a litany of demands including:

  • Publishing standardized test scores for admitted students by race, sex and ethnicity
  • Capping foreign student enrollment at 15%
  • Prohibiting transgender females from using women’s locker rooms and bathrooms
  • Freezing tuition for five years

So far, none have accepted the offer, with seven universities rejecting it outright. The University of Texas at Austin and Vanderbilt University did not publicly rebuke the compact, but did not sign it. New College of Florida, which was not one of the nine, said it would sign if given the chance. Other universities signed separate agreements with the administration to unfreeze federal money. Columbia University, for example, paid $221 million and accepted a host of conditions to regain access to billions of federal dollars.

This story was produced by The Hechinger Report, a nonprofit, independent news organization focused on inequality and innovation in education, and reviewed and distributed by Stacker.

Topics:

Careers & Education

Posts navigation

Older posts
Newer posts
Featured Jobs
Association for Computing Machinery
Executive Editor
Association for Computing Machinery
New York City, NY USA

Delaware River Joint Toll Bridge Commission
Director of Communications
Delaware River Joint Toll Bridge Commission
Yardley, PA

Hearst Television
Account Executive
Hearst Television
Array

All Jobs »
PREMIUM MEMBER

Catherine Wolinski

BROOKLYN, NY
7 Years Experience
I'm a freelance writer specializing in craft beer, small businesses, sustainability and bar/restaurant news. I currently contribute to publications...
View Full Profile »
Join Mediabistro Membership Today

Stand out from the crowd with a premium profile

Mediabistro Logo Find your next media job or showcase your creative talent
  • Job Search
  • Hot Jobs
  • Membership
  • Newsletter
  • Career Advice
  • Media News
  • Hiring Tips
  • Creative Tools
  • About
Facebook YouTube Instagram LinkedIn
Copyright © 2026 Mediabistro
  • Terms of Use
  • Terms of Service
  • Privacy