Alena Mozhjer // Shutterstock
The 20 most affordable cities in New York to buy a house
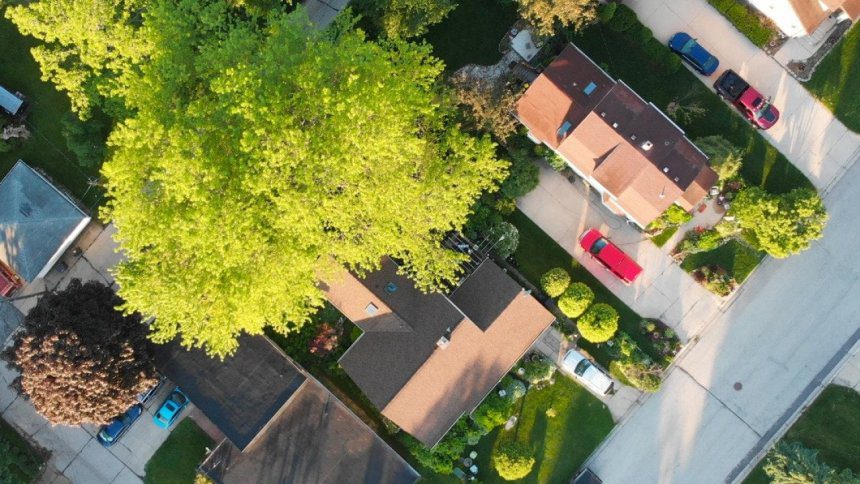
Homeownership is fundamental to the American dream. It offers wealth, security, community, and countless other benefits. Yet for many New York residents, the dream feels increasingly out of reach—even as incomes rise and mortgage rates fall. Near-record prices have made homes hard to come by and often even harder to afford, leaving buyers and sellers stuck and younger generations priced out.
But affordable pockets still exist. In cities across the state, residents can comfortably spend around 30% of their income or less on housing, which is widely considered the affordable threshold.
To find out where these cities are, Redfin Real Estate ranked the most affordable cities in New York, based on their local payment to income ratios. All data is an average for the January-October 2025 period. To see the most affordable cities in the country, read this recent Redfin article.
#1. Tonawanda Town, New York
– Payment to income ratio: 27.0%
– Median sale price: $270,501
– Median household income: $76,644
– Income needed to buy: $69,076
– Median monthly mortgage payment: $1,727
– See homes for sale in Tonawanda Town on Redfin.com
#2. Cheektowaga, New York
– Payment to income ratio: 27.6%
– Median sale price: $239,216
– Median household income: $66,293
– Income needed to buy: $61,087
– Median monthly mortgage payment: $1,527
– See homes for sale in Cheektowaga on Redfin.com
#3. North Tonawanda, New York
– Payment to income ratio: 27.8%
– Median sale price: $242,646
– Median household income: $66,774
– Income needed to buy: $61,963
– Median monthly mortgage payment: $1,549
– See homes for sale in North Tonawanda on Redfin.com
#4. West Seneca, New York
– Payment to income ratio: 30.0%
– Median sale price: $295,040
– Median household income: $75,465
– Income needed to buy: $75,342
– Median monthly mortgage payment: $1,884
– See homes for sale in West Seneca on Redfin.com
#5. West Islip, New York
– Payment to income ratio: 33.8%
– Median sale price: $755,077
– Median household income: $171,045
– Income needed to buy: $192,819
– Median monthly mortgage payment: $4,820
– See homes for sale in West Islip on Redfin.com
#6. New City, New York
– Payment to income ratio: 35.6%
– Median sale price: $811,368
– Median household income: $174,479
– Income needed to buy: $207,193
– Median monthly mortgage payment: $5,180
– See homes for sale in New City on Redfin.com
#7. Deer Park, New York
– Payment to income ratio: 36.0%
– Median sale price: $652,818
– Median household income: $138,950
– Income needed to buy: $166,705
– Median monthly mortgage payment: $4,168
– See homes for sale in Deer Park on Redfin.com
#8. Holbrook, New York
– Payment to income ratio: 36.8%
– Median sale price: $667,920
– Median household income: $139,116
– Income needed to buy: $170,562
– Median monthly mortgage payment: $4,264
– See homes for sale in Holbrook on Redfin.com
#9. Commack, New York
– Payment to income ratio: 37.1%
– Median sale price: $825,716
– Median household income: $170,375
– Income needed to buy: $210,857
– Median monthly mortgage payment: $5,271
– See homes for sale in Commack on Redfin.com
#10. Centereach, New York
– Payment to income ratio: 37.8%
– Median sale price: $626,423
– Median household income: $127,106
– Income needed to buy: $159,965
– Median monthly mortgage payment: $3,999
– See homes for sale in Centereach on Redfin.com
#11. Shirley, New York
– Payment to income ratio: 38.3%
– Median sale price: $526,686
– Median household income: $105,379
– Income needed to buy: $134,496
– Median monthly mortgage payment: $3,362
– See homes for sale in Shirley on Redfin.com
#12. Huntington Station, New York
– Payment to income ratio: 38.5%
– Median sale price: $648,206
– Median household income: $129,121
– Income needed to buy: $165,528
– Median monthly mortgage payment: $4,138
– See homes for sale in Huntington Station on Redfin.com
#13. Hicksville, New York
– Payment to income ratio: 38.9%
– Median sale price: $752,458
– Median household income: $148,008
– Income needed to buy: $192,150
– Median monthly mortgage payment: $4,804
– See homes for sale in Hicksville on Redfin.com
#14. West Babylon, New York
– Payment to income ratio: 39.0%
– Median sale price: $649,807
– Median household income: $127,785
– Income needed to buy: $165,937
– Median monthly mortgage payment: $4,148
– See homes for sale in West Babylon on Redfin.com
#15. Baldwin, New York
– Payment to income ratio: 39.0%
– Median sale price: $711,397
– Median household income: $139,840
– Income needed to buy: $181,664
– Median monthly mortgage payment: $4,542
– See homes for sale in Baldwin on Redfin.com
#16. Lindenhurst, New York
– Payment to income ratio: 39.1%
– Median sale price: $658,534
– Median household income: $129,033
– Income needed to buy: $168,165
– Median monthly mortgage payment: $4,204
– See homes for sale in Lindenhurst on Redfin.com
#17. Levittown, New York
– Payment to income ratio: 39.2%
– Median sale price: $714,437
– Median household income: $139,696
– Income needed to buy: $182,441
– Median monthly mortgage payment: $4,561
– See homes for sale in Levittown on Redfin.com
#18. Plainview, New York
– Payment to income ratio: 39.7%
– Median sale price: $961,484
– Median household income: $185,531
– Income needed to buy: $245,527
– Median monthly mortgage payment: $6,138
– See homes for sale in Plainview on Redfin.com
#19. Oceanside, New York
– Payment to income ratio: 40.3%
– Median sale price: $763,653
– Median household income: $145,282
– Income needed to buy: $195,009
– Median monthly mortgage payment: $4,875
– See homes for sale in Oceanside on Redfin.com
#20. Central Islip, New York
– Payment to income ratio: 40.7%
– Median sale price: $584,903
– Median household income: $110,166
– Income needed to buy: $149,363
– Median monthly mortgage payment: $3,734
– See homes for sale in Central Islip on Redfin.com
This story was
produced by
Redfin Real Estate and reviewed and
distributed by Stacker.