Mediabistro Logo Mediabistro Logo
  • Jobs
    Search Creative Jobs Hot Jobs Remote Media Jobs Create Job Alerts
    Job Categories
    Creative & Design Marketing & Communications Operations & Strategy Production Sales & Business Development Writing & Editing
    Quick Links
    Search All Jobs Remote Jobs Create Job Alerts
  • Career Resources
    Career Advice & Articles Media Industry News Media Career Interviews Creative Tools Resume Writing Services Interview Coaching Job Market Insights Member Profiles
  • Mediabistro Membership
    Membership Overview How to Pitch (Premium Tool) Editorial Calendars (Premium Access) Courses & Training Programs Membership FAQ
  • Showcase
    Featured Creative Stories Submit your Story
  • Log In
Post Jobs
Mediabistro Logo Mediabistro Logo
Search Creative Jobs Hot Jobs Remote Media Jobs Create Job Alerts
Job Categories
Creative & Design Marketing & Communications Operations & Strategy Production Sales & Business Development Writing & Editing
Quick Links
Search All Jobs Remote Jobs Create Job Alerts
Career Advice & Articles Media Industry News Media Career Interviews Creative Tools Resume Writing Services Interview Coaching Job Market Insights Member Profiles
Membership Overview How to Pitch (Premium Tool) Editorial Calendars (Premium Access) Courses & Training Programs Membership FAQ
Featured Creative Stories Submit your Story
Log In
Post Jobs
Log In | Sign Up

Follow Us!

Careers & Education

How education changed in one year under Trump

How education changed in one year under Trump
By Nirvi Shah for The Hechinger Report
7 min read • Originally published January 20, 2026 / Updated March 19, 2026
By Nirvi Shah for The Hechinger Report
7 min read • Originally published January 20, 2026 / Updated March 19, 2026

US President, Donald Trump, displaying a signed executive order aimed at closing the Education Department during an event at the White House on March 20, 2025 in Washington, D.C.

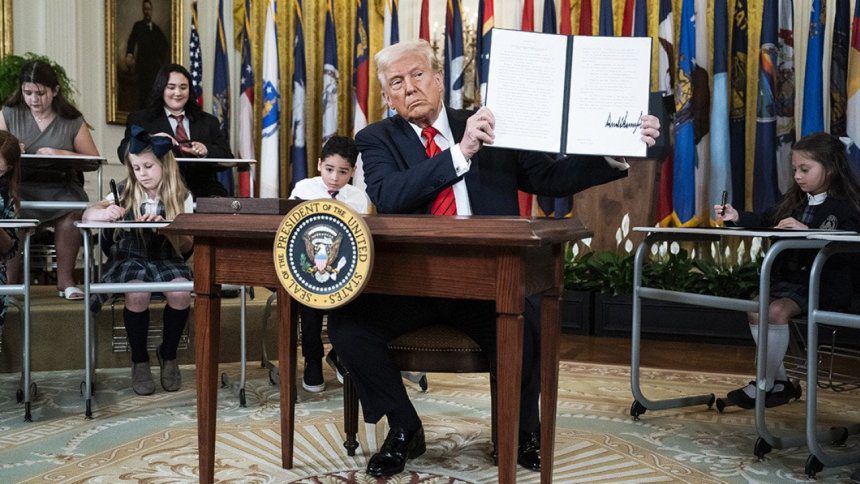
Jabin Botsford // The Washington Post via Getty Images

How education changed in one year under Trump

Even with a conservative think tank’s blueprint detailing how the second Trump administration should reimagine the federal government’s role in education, few might have predicted what actually materialized this year for America’s schools and colleges.

Or what might be yet to come.

“2025 will go down as a banner year for education: the year we restored merit in higher education, rooted out waste, fraud and abuse, and began in earnest returning education to the states,” Education Secretary Linda McMahon told The Hechinger Report. She listed canceling K-12 grants she called wasteful, investing more in charter schools, ending college admissions that consider race or anything beyond academic achievement and making college more affordable as some of the year’s accomplishments.

“Best of all,” she said, “we’ve begun breaking up the federal education bureaucracy and returning education control to parents and local communities. These are reforms conservatives have championed for decades — and in just 12 months, we’ve made them a reality.”

McMahon’s characterization of the year is hardly universal. Earlier this month, Senate Democrats, led by independent Sen. Bernie Sanders, called out some of the administration’s actions this year. They labeled federal changes, especially plans to divide the Education Department’s duties across the federal government, as dangerous and likely to cause chaos for schools and colleges.

“Already, this administration has cancelled billions of dollars in education programs, illegally withheld nearly $7 billion in formula funds, and proposed to fully eliminate many of the programs included in the latest transfer,” the senators wrote in a letter to Republican Sen. Bill Cassidy, chair of the committee that oversees education. “In our minds, that is unacceptable.”

So, what really happened to education this year? It was almost impossible for the average observer to keep track of the array of changes across colleges and universities, K-12 schools, early education and education research — and what it has all meant. The Hechinger Report takes a look back at how the education world was transformed.

Higher education

The administration was especially forceful in the higher education arena. It used measures including anti-discrimination law to quickly freeze billions of dollars in higher education research funding, interrupting years-long medical studies and coercing Columbia, Brown, Northwestern and other institutions into handing over multimillion-dollar payments and agreeing to policy changes demanded by the administration.

A more widespread “compact” promising preference for federal funding to universities that agreed to largely ideological principles had almost no takers. But in the face of government threats, universities and colleges scrapped diversity, equity and inclusion, or DEI, programs that provided support based on race and other characteristics, and banned transgender athletes from competing on teams corresponding to genders other than the ones they were assigned at birth.

As the administration unleashed its set of edicts, Republicans in Congress also expanded taxes on college and university endowments. And the One Big Beautiful Bill Act made other big changes to higher education, such as limiting graduate student borrowing and eliminating certain loan forgiveness programs. That includes public service loan forgiveness for graduates who take jobs with organizations the administration designated as having a “substantial illegal purpose” because they help refugees or transgender youth. In response, states, cities, labor unions and nonprofits immediately filed suit, arguing that the rule violated the First Amendment.

The administration has criticized universities, colleges and liberal students for curbing the speech of conservatives by shouting them down or blocking their appearances on campuses. However, it proceeded to revoke the visas of and begin deportation proceedings against international students who joined protests or wrote opinions criticizing Israeli actions in Gaza and U.S. government policy there.

Meanwhile, emboldened legislatures and governors in red states pushed back on what faculty could say in classrooms. College presidents, including James Ryan at the University of Virginia and Mark Welsh III at Texas A&M were forced out in the aftermath of controversies over these issues. — Jon Marcus

K-12 education

Since Donald Trump returned to office earlier this year, K-12 schools have lost millions of dollars in sweeping cuts to federal grants, including money that helped schools serve students who are deaf or blind, grants that bolstered the dwindling rural teacher workforce and funding for Wi-Fi hotspots.

Last summer, the Trump administration briefly froze billions of dollars in federal funding for schools on June 30, one day before districts would typically apply to receive it. Although the money was restored in late July, some school leaders said they no longer felt confident they would receive all expected federal funds next year. And they are braced for more cuts to federal budgets as the U.S. Department of Education is dismembered.

That process, as well as the end goal of returning the department’s responsibilities to the states, has raised uncertainty about whether federal money will continue to be earmarked for the same purposes. If the state of Illinois is in charge of federal funding for every school in the state, said Todd Dugan, superintendent of a rural Illinois district, will rural schools still get money to boost student achievement or will the state decide there are more pressing needs?

As part of layoffs at the Education Department during the government shutdown in the fall, the Trump administration cut loose almost everyone who works in the Office of Special Education Programs, alarming many parents and advocates. About 7.5 million children ages 3 to 21 are served under federal law protecting students with disabilities, and the office had already lost staffers after the Trump administration dismissed nearly half the Education Department’s staff in March. Some worry this additional round of layoffs is a big step toward moving oversight of how states treat students with disabilities to the Department of Health and Human Services.

Even as the Trump administration attempts to push more control over education to the states, it has aggressively expanded federal power over school choice and transgender student rights in public schools. The One Big Beautiful Bill Act will create a federal school voucher program, allowing taxpayers to donate up to $1,700 for scholarships that families can use to pay for private school. The program won’t start until 2027, and states can choose whether to participate — setting up potentially divisive fights over new money for education in Democratic-controlled states.

Already, some Democratic-led states have come to the defense of schools in funding and legal fights with the federal government over transgender athletes participating in sports. The U.S. departments of Education and Justice launched a special investigations team to look into complaints of Title IX violations, targeting school districts and states that don’t restrict accommodations or civil rights protections for transgender students. Legal experts expect the U.S. Supreme Court to ultimately decide how Title IX — a federal law that prohibits sex discrimination in education — applies to public schools.

The federal government directly runs just two systems of schools — one for military families and the other for children of tribal nations. In an executive order signed in January, the president directed both systems to offer parents a portion of federal funding allocated to their children to attend private, religious or charter schools.

And as part of the dismantling of the federal Education Department, the Interior Department — which oversees 183 tribal schools across nearly two dozen states — will assume greater control of Indian education programs. In addition to rolling out school choice at its campuses, the department will take over Indian education grants to public schools across the country, Native language programs, Alaska Native and Native Hawaiian programs, tribally controlled colleges and universities, and many other institutions. — Ariel Gilreath and Neal Morton

Early education

Early education was not at the top of Trump’s agenda when he returned to office. On the campaign trail, when asked if he would support legislation to make child care affordable, he gave an unfocused answer, suggesting tariff revenue could be tapped to bring down costs. Asked a similar question, Vice President JD Vance suggested that care by family members was one potential solution to child care shortages.

However, many of the administration’s actions, including cuts to the government workforce and grants, have affected children who depend on federal support. In April, the administration abruptly closed five of 10 regional offices supporting Head Start, the free, federally funded early childhood program for children from low-income families. Head Start program managers worried they would be caught up in a freeze on grant funding that affected all agencies. Even though administration officials said funds would keep flowing to Head Start, some centers reported having problems drawing down their money. The prolonged government shutdown, which ended Nov. 12 after 43 days, also forced some Head Start programs to temporarily close.

Though the shutdown is over, Head Start advocates are still worried. Many of the administration’s actions have been guided by the Project 2025 policy document created by the conservative Heritage Foundation. Project 2025 calls for eliminating Head Start, which serves about 715,000 children from birth to age five, for a savings of about $12 billion a year.

The One Big Beautiful Bill Act contained some perks for parents, including an increase in the child tax credit from $2,000 to $2,200. The bill also created a new program called Trump accounts: Families can contribute up to $5,000 each year until a child turns 18, at which point the Trump account will turn into an individual retirement account. For children born between Jan. 1, 2025, and Dec. 31, 2028, the government will provide a $1,000 bonus. Billionaires Michael and Susan Dell have also promised to contribute $250 to the account of each child ages 10 and under who lives in a ZIP code with a median household income of $150,000 or less.

That program will launch in summer 2026. — Christina A. Samuels

This story was produced by The Hechinger Report, a nonprofit, independent news organization focused on inequality and innovation in education, and reviewed and distributed by Stacker.

Topics:

Careers & Education
Entertainment

Which Grammy nominees ranked highest based on performance data

Which Grammy nominees ranked highest based on performance data
By Kristian Gorenc for Viberate Analytics
5 min read • Originally published January 21, 2026 / Updated March 19, 2026
By Kristian Gorenc for Viberate Analytics
5 min read • Originally published January 21, 2026 / Updated March 19, 2026

Singer Olivia Dean performs at Hot 99.5's iHeartRadio Jingle Ball 2025 at Capital One Arena, Washington, D.C.

Shannon Finney // Getty Images

Which Grammy nominees ranked highest based on performance data

Each awards season, the Grammy nominations prompt a familiar debate: which artists and songs truly defined the year in music? While critical acclaim and cultural impact dominate much of the conversation, audience behavior leaves its own trace across streaming platforms, radio playlists, and video services. Those signals, taken together, offer a clearer picture of which nominees sustained attention over time and which gained momentum as the eligibility period drew to a close.

Viberate Analytics takes a closer look at two of the Grammy Awards’ most closely watched categories — Best New Artist and Song of the Year—by comparing how nominees performed across major music platforms during the eligibility year. Rather than speculating on voting outcomes, the analysis focuses on measurable indicators of reach, growth, and consistency to show which contenders stood out in practice.

Scope of the analysis and data sources

Eight nominees were examined in each category. All artists and songs were evaluated using the same metrics to ensure comparability. The analysis draws on verified performance data from Spotify, YouTube, radio airplay, and Spotify playlists—platforms that collectively capture streaming demand, video consumption, editorial support, and broadcast exposure.

Two timeframes were used. A twelve-month window reflects overall scale and presence during the eligibility period, while a thirty-day window at the end of that period highlights late-year momentum. Daily performance patterns were reviewed to understand trend direction, but aggregated figures formed the basis for comparison. Metrics were normalized within each nominee group so that no single platform disproportionately influenced the results.

Best New Artist: performance signals across platforms

The Best New Artist category brings together performers whose profiles expanded most visibly over the past year. The eight nominees included in this analysis are: 

  • KATSEYE
  • Olivia Dean
  • Alex Warren
  • sombr
  • The Marías
  • Addison Rae
  • Lola Young
  • Leon Thomas

Across the group, performance varied sharply depending on platform. Some artists built their following primarily through video, accumulating hundreds of millions—or even billions—of YouTube views, while others showed steadier gains through streaming and playlist exposure. Radio airplay added another layer, revealing which acts translated listener interest into broader industry support.

Among the nominees, Olivia Dean emerged as the most balanced performer across metrics. Over the twelve-month period, she posted the strongest growth in monthly Spotify listeners within the group, pointing to sustained audience expansion rather than a short-lived spike tied to a single release. Her music also reached the largest audience through Spotify playlists, benefiting from consistent placement in both editorial and algorithmic selections.

Radio data reinforced this trajectory. While several nominees accumulated higher total spin counts earlier in the year, Olivia Dean’s airplay increased steadily toward the end of the eligibility window, suggesting growing adoption by programmers as the year progressed.

Other nominees showed more concentrated strengths. KATSEYE led the group in total YouTube views, reflecting a large and highly engaged video audience. Alex Warren ranked among the strongest in total Spotify streams over the year, while Addison Rae and The Marías maintained notable visibility through playlist reach. These profiles, however, were less evenly distributed across platforms than the top-ranked performer.

Table listing the top new artist nominees and their reach and audience per platform.

Viberate Analytics

Taken together, the data points to Olivia Dean as the strongest overall performer in the Best New Artist field, combining steady audience growth, leading playlist exposure, and increasing radio support during the eligibility period.

Song of the Year: scale, momentum, and staying power

Song of the Year shifts the focus from artist profiles to individual releases. The eight nominated tracks examined in this analysis are: 

  • Golden
  • APT.
  • DtMF
  • WILDFLOWER
  • Abracadabra
  • luther (with sza)
  • Manchild
  • Anxiety

Across the twelve-month window, the nominated songs displayed wide variation in scale. Some tracks surpassed a billion Spotify streams during the year, while others remained closer to the hundred-million range. YouTube view counts showed an even broader spread, and radio airplay concentrated around a smaller group of songs that received sustained rotation.

Golden stood out most clearly when recent activity was taken into account. During the final thirty days of the eligibility period, the track generated approximately 148 million Spotify streams, nearly 149 million YouTube views, and more than 35,000 radio airplay spins—leading the nominee group across all three measures. This pattern indicates that the song retained listener attention and programming support deep into the award cycle.

Over the full year, Golden also ranked first in total radio airplay, with roughly 280,000 spins, and led all nominees in Spotify playlist reach. By contrast, APT. recorded the highest total Spotify streaming volume across the year, exceeding one billion streams, but its peak activity occurred earlier in the eligibility period, with comparatively lower momentum at the end.

Other nominees showed distinct but narrower strengths. Abracadabra ranked near the top in radio airplay, reflecting strong broadcaster support, while DtMF posted solid streaming totals without matching the leading tracks’ video reach. These differences highlight how overall rankings shift depending on whether long-term scale or late-year momentum is emphasized.

Table listing best song and artist nominees and their reach and audience values per platform.

Viberate Analytics

Viewed across all measured indicators, Golden ranks highest among the Song of the Year nominees, combining sustained yearlong reach with dominant late-period momentum.

Interpreting the results

Performance data offers one lens through which to view the Grammy nominations. Streaming, video consumption, playlists, and radio airplay each capture different dimensions of audience engagement and industry support, and no single metric tells the whole story. Considered together, however, they help clarify which nominees maintained attention across platforms and which gained traction as the year unfolded.

Conclusion

Across both categories, the performance data highlights clear front-runners. In the Best New Artist field, Olivia Dean shows the strongest overall mix of audience growth, playlist reach, and increasing radio presence during the eligibility period. In the Song of the Year category, Golden separates itself through sustained performance across streaming, video, playlists, and radio, while also maintaining strong momentum in the final weeks of the year.

Taken together, the results offer a grounded view of how this year’s nominees resonated with listeners and programmers over time. While awards outcomes are shaped by many factors beyond measurable performance, the data adds context to the broader Grammy conversation by showing which artists and songs consistently held attention throughout the year.

This story was produced by Viberate Analytics and reviewed and distributed by Stacker.

Topics:

Entertainment
Careers & Education

The skills gap crisis: Boomers are retiring before the next generation is ready

The skills gap crisis: Boomers are retiring before the next generation is ready
By Tiffany Miller for Kelly
3 min read • Originally published January 22, 2026 / Updated March 19, 2026
By Tiffany Miller for Kelly
3 min read • Originally published January 22, 2026 / Updated March 19, 2026

A senior employee working with a younger colleague on a task in an office.

Zamrznuti tonovi // Shutterstock

The skills gap crisis: Boomers are retiring before the next generation is ready

For decades, experienced professionals have quietly kept the world running, training new hires, solving crises and carrying institutional knowledge built over long careers. Now, many of those workers are preparing to retire, taking with them expertise that cannot be quickly replaced.

A new global survey from Kelly shows that while most organizations know the “Silver Tsunami” is coming, few are prepared for what happens next.

Across regions, executives say experience is slipping away faster than they can replace it. In Europe and North America, retirements are already affecting operations, while in Asia and the Middle East, demand for technical expertise continues to climb.

As millions of baby boomers exit the workforce, companies across industries are struggling to replace both the labor and the know-how that leave with them.

Prepared on paper, not in practice

Executives and employees know the retirement wave is coming, but they do not know what happens next. Ninety-two percent of executives say they are concerned that retirements will worsen worker shortages, leaving critical gaps in the workforce, and nearly 4 in 10 are very or extremely worried, according to the research. Workers share those concerns. Eighty-one percent say they worry their employers will not be able to replace outgoing employees, including 28 percent who are highly concerned.

An infographic showing 92% of executives are concerned that retirements will worsen worker shortages, while 81% of employees worry their employers will not be able to replace retiring workers.

Kelly

The views are split on preparedness. Two in 3 executives say their organizations are ready to keep operations running as older workers retire. Only 17 percent of employees agree.

An infographic showing 67% of executives and 17% of employees agree if they think organizations are prepared to keep operations running as workers retire.

Kelly

Many workers see a system running on borrowed time, with institutional knowledge walking out the door faster than it can be passed down.

A problem money cannot fix

Across industries, organizations are trying to offset the loss of experienced workers by redesigning roles, investing in technology or relying more heavily on automation. But replacing people with tools does not replace experience. Knowledge takes time to build, and many midcareer professionals have not received the training or mentorship needed to step into more complex roles.

Researchers warn that when expertise is not transferred, productivity dips, innovation slows and mistakes multiply. The impact is not just technical. Entire ways of working risk being lost as organizations modernize without preparing their people for what comes next.

Fewer than half of executives say they have formal programs to transfer knowledge before employees retire, and only 38 percent report investing in midcareer development at scale. The result is a widening experience gap between senior specialists and the workers expected to replace them.

Rebuilding the pipeline

Research points to a few solutions that go beyond short-term hiring. Successful organizations are pairing senior and junior workers to capture insights before they disappear. Many are adopting a “skills-first” approach that looks past resumes to find potential in veterans, midcareer switchers and people with nontraditional backgrounds. They are also making learning part of advancement, linking training programs to real opportunities for growth.

Some companies are looking outside their walls for support, using strategic outsourcing to bridge experience gaps and maintain continuity during transitions.

A turning point for talent

The skills gap is not a distant threat. It is already reshaping teams, production lines and offices around the world. How organizations respond will determine whether they lose momentum or create a new generation of capable, confident workers ready to lead.

Research makes the choice clear. Future-ready companies invest in people before the crisis hits. The expertise leaving today can become the foundation for tomorrow if leaders act now to transfer it.

The report notes that organizations focused on resilience, including those that prioritize upskilling, flexible teams and inclusive hiring, are twice as likely to say they are prepared for the future. Building that resilience now could determine which companies thrive in the next decade of work.

This story was produced by Kelly and reviewed and distributed by Stacker.

Topics:

Careers & Education
Careers & Education

Layoffs are rising: Here’s where Americans are experiencing the most job disruption

Layoffs are rising: Here’s where Americans are experiencing the most job disruption
By Shawn Tyler for PeopleFinders
5 min read • Originally published January 22, 2026 / Updated March 19, 2026
By Shawn Tyler for PeopleFinders
5 min read • Originally published January 22, 2026 / Updated March 19, 2026

A view of the river and city skyline in Cleveland, Ohio.

Sean Pavone // Shutterstock

Layoffs are rising: Here’s where Americans are experiencing the most job disruption

It’s been more than five years since the worst of the COVID-19 pandemic, and the U.S. unemployment rate seems to have settled down for the most part after an April 2020 high of nearly 15%.

After the rate hovered between 3% and 4% between 2022 and 2024, it has slightly increased since the start of 2025. The latest data from the Bureau of Labor Statistics has the nationwide rate at 4.6%. December 2025 saw more bad news, as the total number of layoffs reached one million for the first year since 2020.

Why Are Layoffs Increasing?

One of the primary reasons for the increase in layoffs has been the continued adoption of artificial intelligence (AI), with companies surveyed in a report by Challenger, Gray & Christmas citing it as the cause of nearly 55,000 layoffs since January 2025. Another common reason for layoffs in 2025 was restructuring, which is a broad term that companies can use in numerous situations.

More reasons for the gradual increase in layoffs include economic uncertainty over tariffs, general macroeconomic conditions, and impacts from the Department of Government Efficiency cuts. DOGE alone is responsible for nearly 300,000 layoffs in 2025. PeopleFinders examines where people in the U.S. are experiencing the highest unemployment rate increases.

12 Locations Americans Are Experiencing the Most Job Disruption

Although the national unemployment rate has risen over the past year, some metropolitan areas are seeing decreased unemployment. Job markets are strong in Oklahoma, Indiana, Alabama, and Nebraska, for instance.

Other areas are not as lucky. According to the Bureau of Labor Statistics, more U.S. metros with a population of at least one million lost jobs between July 2024 and July 2025. Twelve of those large metros had unemployment rates increase by at least half a percentage point in that time span.

1. Cleveland, Ohio

Among the nation’s 56 largest metros, Cleveland saw the highest unemployment rate increase (0.8%) between July 2024 and July 2025. The rate today stands at around 5.2%. Manufacturing and hospitality jobs have taken a hit in the Cuyahoga region, and college graduates have found it more difficult to secure white-collar jobs.

2. Portland-Vancouver-Hillsboro, Oregon-Washington

While Seattle’s unemployment rate held steady, its neighbor to the south, Portland, hasn’t been as fortunate. The rate increased by 0.7% between July 2024 and July 2025. Intel’s Portland-area facilities shed thousands of jobs in 2025; manufacturing (specifically semiconductors) was hit hard.

3. Columbus, Ohio

Ohio’s largest city, Columbus, was also affected by the recent uptick in unemployment. The decrease in leisure, hospitality, and goods-producing jobs accounted for much of the 0.7% increase.

4. Washington-Arlington-Alexandria, DC-Virginia-Maryland-West Virginia

Cuts to the federal workforce—notably through DOGE—led to the DMV having the highest monthly unemployment increases during the first half of 2025. While the trend is starting to level off, the D.C. area still saw a 0.6% rise from July 2024 to July 2025.

5. Virginia Beach-Chesapeake-Norfolk, Virgina-North Carolina

The story is much the same in Southeastern Virginia, where the unemployment rate also rose by 0.6%. The reduction in federal workers has also led to fewer jobs for government contractors, who make up a significant portion of the Virginia Beach area.

6. Memphis, Tennessee-Mississippi-Arkansas

On top of consistently high rates of violent crime, the Memphis metropolitan area is also experiencing an unemployment rate increase of around 0.6%. No clear reasons seem to exist for the surge, but some data suggest the region’s lack of high-paying jobs could be partially to blame.

7. Hartford-West Hartford-East Hartford, Connecticut

Although the unemployment rate in Connecticut is under 4%, the state’s largest metro has seen a rate increase of 0.6% from July 2024 to July 2025. Around 4.3% of Hartford’s workforce is currently unemployed.

8. Sacramento-Roseville-Folsom, California

California’s unemployment rate stands at 5.6%, which is the highest among all states and behind only Washington, D.C.’s rate of 6.2%. In addition to job cuts in the hospitality and entertainment industry, large tech companies are beginning to downsize in response to AI-related disruptions. Sacramento has felt this squeeze more than other areas, as shown by its unemployment rate increase of 0.5%.

9. Fresno, California

No other U.S. metro with at least 1 million residents had a higher unemployment rate in August 2025 than Fresno in California’s Central Valley. Between July 2024 and July 2025, the region’s rate increased by 0.5%, from 8.1% to 8.6%.

10. Riverside-San Bernardino-Ontario, California

Riverside’s rising unemployment (0.5%) shows that California’s job woes extend to every corner of the state. Construction and manufacturing accounted for many of the area’s losses.

11. Cincinnati, Ohio-Kentucky-Indiana

Columbus and Cleveland are not the only large cities in Ohio with rising unemployment. Cincinnati’s diversified economy, however, has kept the rate increase at a relatively cool 0.5%.

12. Grand Rapids-Wyoming-Kentwood, Michigan

Western Michigan experienced an increase of 0.5% between July 2024 and July 2025, but its current rate of 5.5% is still lower than Detroit’s unemployment rate of 5.7%. A contributing factor to Michigan’s relatively high jobless rate is the recent increase in unemployment benefits.

Should You Avoid Areas with Rising Unemployment?

While rising unemployment rates are seldom signs of strong economies, workers in some industries (such as healthcare and data science) are better insulated from mass layoffs. Trends don’t last forever, either; Florida’s historically low unemployment rate of 2.8% in early 2023 has crept up to 3.9% at the end of 2025, for instance.

On the other hand, regions with high unemployment often experience collateral consequences, such as low economic growth and elevated crime rates.

Even within regions with favorable economic conditions, cities, towns, and neighborhoods vary in their attractiveness. Job seekers have many variables to consider when weighing the pros and cons of relocation, not the least of which is the overall strength of companies extending job offers.

In this era of rising job scams, it’s also important to verify the identities of hiring managers with a people finder and run a reverse phone lookup on the number they’re calling from. Every reasonable measure to prevent scams is worth it in today’s economic climate.

This story was produced by PeopleFinders and reviewed and distributed by Stacker.

Topics:

Careers & Education
Careers & Education

The Remote Job Market Is Still Strong Despite Return-to-Office Mandates

The Remote Job Market Is Still Strong Despite Return-to-Office Mandates
By Matthew Campbell-Miller for Toptal
3 min read • Originally published January 22, 2026 / Updated March 19, 2026
By Matthew Campbell-Miller for Toptal
3 min read • Originally published January 22, 2026 / Updated March 19, 2026

A woman using a laptop working from home.

Branislav Nenin // Shutterstock

Remote job market still strong despite return-to-office mandates

High-profile return-to-office mandates at companies like JPMorgan Chase and Microsoft dominated headlines in 2025, but a new job report shows that remote work continues to play an important role in the modern labor market. Toptal’s High-Skilled Job Report for Q4 2025 found that demand for experienced remote and hybrid technology and professional services personnel is actually slightly stronger than that for comparable in-office positions.

The report found that global demand for these remote and hybrid professionals increased by 19.8% in Q4 2025 versus Q4 2024. Looking at the entire year, demand increased 10.9% in 2025 versus 2024. Meanwhile, demand for similar professionals across all work models, including remote, hybrid, and in-office roles, increased by slightly smaller magnitudes (19.4% for Q4 2025 versus Q4 2024 and 10.4% for full-year 2025 versus 2024).

The difference in the trends is very small, but still worth noting, according to the report. For remote and hybrid roles to exceed the blended average, in-office roles must be lagging behind, pulling down the overall figure.

Graphic showing that demand for experienced tech and professional services experts increased nearly 20% year over year in Q4 2025.

Toptal

Quarter-over-quarter data tells a similar story. Demand for remote and hybrid talent declined by 4%, a typical late-year contraction; however, the broader experienced market, which includes in-office roles, showed a slightly larger decline of 4.7%.

Remote Work Is Finding Its Level

Five years after the height of COVID-19 pandemic disruption, data suggests that distributed work has settled into a more stable phase. The report notes that office occupancy in major U.S. markets has recovered from its pandemic lows but remains well below 2019 levels. This points to an emerging equilibrium between remote, hybrid, and in-office work in which companies have begun to pinpoint when in-person collaboration is essential and when work can be done remotely.

This shift mirrors the adoption of AI, in which companies’ early experiments have evolved into strategic combinations of technology and human insight. Together, these changes point to a more deliberate approach to the future of work. Having tested remote policies and AI tools for several years, companies are now making clearer choices about where work happens and how technology supports it. They are increasingly implementing AI-driven tools and in-person work into the parts of the workflow where they add the most value.

Table listing several areas of expertise in the remote and hybrid job market that had strong demand in Q4, including data science, development, marketing, and product management.

Toptal

While it’s clear that many employees enjoy the flexibility of remote and hybrid work, the availability of these roles has grown for reasons that go beyond employee preference or cost-savings for companies, according to the report. Firms that strategically employ remote and hybrid teams are able to access larger and more diverse talent pools and hire faster, especially when scaling or experimenting with new capabilities.

This transitional job market is challenging for both workers and employers, but this data points to a potential bright spot: that flexible work for experienced professionals is not dying, rather it is maturing into a permanent feature of the market.

This story was produced by Toptal and reviewed and distributed by Stacker.

Topics:

Careers & Education
Careers & Education

Planning life after high school isn’t easy: 4 tips for students and their families

Planning life after high school isn’t easy: 4 tips for students and their families
By Shannon Pickett for The Conversation
4 min read • Originally published January 23, 2026 / Updated March 19, 2026
By Shannon Pickett for The Conversation
4 min read • Originally published January 23, 2026 / Updated March 19, 2026

An illustration of a graduation concept, with a five students outside a school with a lightbulb and three arrows pointing in different paths.

Turn_around_around // Shutterstock

Planning life after high school isn’t easy: 4 tips for students and their families

Many high school seniors are now focusing on what they will do once they graduate — or on the fact that they don’t at all know what is to come.

Families trying to guide and support these students at the juncture of a major life transition likely also feel nervous about the open-ended possibilities, including starting at a standard four-year college or not attending college at all.

Writing in The Conversation, Purdue University psychology professor Shannon Pickett, a mental health counselor, shares four tips to help make deciding what comes after high school a little easier for everyone involved.

1. Shadow someone with a job you might want

Many college students are interested in a particular career path, but are not familiar with the job’s day-to-day workings.

A parent, teacher or another adult in this student’s life could connect them with someone they shadow at work, even for a day, so the student can better understand what the job entails.

High school students may also find that interviewing someone who works in a particular field is another helpful way to narrow down career path options or finalize their college decisions.

Research published in 2025 shows that high school students who complete an internship are better able to decide whether certain careers are a good fit for them.

2. Look at the numbers

Full-time students can pay anywhere from about $4,000 for in-state tuition at a public state school per semester to just shy of $50,000 per semester at a private college or university. The average annual cost of tuition alone at a public college or university in 2025 is $10,340, while the average tuition cost at a private school is $39,307.

Tuition continues to rise, though the rate of growth has slowed in the past few years.

About 56% of 2024 college graduates had taken out loans to pay for college.

Concerns about affording college often come up with clients who are deciding on whether or not to get a degree. Research has shown that financial stress and debt load are leading to an increase in students dropping out of college.

It can be helpful for some students to look at tuition costs and project what their monthly student loan payments would be like after graduation, given the expected salary range in particular careers. Financial planning could also help students consider the benefits and drawbacks of public, private, community colleges or vocational schools.

Even with planning, there is no guarantee that students will be able to get a job in their desired field, or quickly earn what they hope to make. No matter how prepared students might be, they should recognize that there are still factors outside their control.

3. Normalize other kinds of schools

Some students feel they should go to a four-year college right after they graduate because it is what their families expect. There are students and parents who see a four-year college as more prestigious than a two-year program, and believe it is more valuable in terms of long-term career growth.

That isn’t the right fit for everyone, though.

Enrollment at trade-focused schools increased almost 20% from the spring of 2020 through 2025, and now comprises 19.4% of public two-year college enrollment.

Going to a trade school or seeking a two-year associate’s degree can put students on a direct path to get a job in a technical area, such as becoming a registered nurse or electrician.

But there are also reasons for students to think carefully about trade schools.

In some cases, trade schools are for-profit institutions and have been subjected to federal investigation for wrongdoing. Some of these schools have been fined and forced to close.

Still, it is important for students to consider which path is personally best for them.

Research has shown that job satisfaction has a positive impact on mental health, and having a longer history with a career field leads to higher levels of job satisfaction.

4. Consider a gap year before shutting down the idea

One strategy that high school graduates have used in recent years is taking a year off between high school and college in order to better determine what is the right fit for a student. Approximately 2% to 3% of high school graduates take a gap year — typically before going on to enroll in college.

Some young people may travel during a gap year, volunteer, or get a job in their hometown.

Whatever the reason students take gap years, the time off can be beneficial in certain situations. Taking a year off before starting college has also been shown to lead to better academic performance in college.

This story was produced by The Conversation and reviewed and distributed by Stacker.

Topics:

Careers & Education
Careers & Education

Why Leaders Are Working More and Leading Less

Why Leaders Are Working More and Leading Less
By Eric Czerwonka for Buddy Punch
7 min read • Originally published January 27, 2026 / Updated March 19, 2026
By Eric Czerwonka for Buddy Punch
7 min read • Originally published January 27, 2026 / Updated March 19, 2026

A businessman illustrated with multiple arms and hands as a concept of multitasking.

alphaspirit.it // Shutterstock

Why leaders are working more and leading less

Most leaders wouldn’t describe their workplaces as chaotic. The tools are in place. The systems mostly work. And on the surface, things feel manageable.

But beneath that sense of control, those systems come with a cost. Software is quietly reshaping how leaders spend their time, and what gets pushed aside as a result.

Recent workplace research suggests this tension between “manageable” and costly is becoming more widespread. Reporting in Forbes has described a growing phenomenon known as digital tool fatigue, where the accumulation of apps, platforms, and notifications begins to undermine productivity, collaboration, and leadership effectiveness rather than support it. Employees describe spending increasing amounts of time switching between tools, tracking down information, and keeping up with conversations — work that feels necessary but is rarely high-impact.

To understand how today’s tools are affecting real workdays, Buddy Punch surveyed U.S. professionals about their tool environments, how their time is allocated during the week, and what work is most impacted by software management. The findings reveal a consistent pattern: Even when tools feel manageable, they demand far more attention than most organizations realize.

Key Findings

  • Most respondents (71%) say their tool environments are manageable, yet tools still absorb a large share of leaders’ workweeks
  • More than one-third of the time is spent coordinating or troubleshooting tools, crowding out higher-value leadership work
  • Innovation, strategy, and people-focused work take the biggest hit from software demands
  • Simplifying tools is widely expected to improve morale, speed decisions, and free up leadership time

A set of graphics showing data on how manageable today's tool stacks feel.

Buddy Punch

When ‘Manageable’ Still Has a Cost

According to the Buddy Punch survey, most respondents (71%) say their organization’s current set of tools is extremely or very manageable when it comes to supporting both operational needs and people or team priorities. That sense of control is especially strong among mid-sized and large organizations (100+ employees), suggesting that scale often brings structure rather than disorder. As companies grow, they tend to formalize processes, define ownership, and invest in clearer systems… all of which can make complex environments feel easier to navigate.

The work model plays a role as well. Fully or mostly remote organizations stand out as the most manageable overall, outperforming hybrid and mostly onsite workplaces. This points to the power of clarity. When expectations around how work happens are consistent — rather than split across multiple modes — systems tend to be designed with more intention, reducing friction over time.

Still, manageability doesn’t mean tools fade into the background. Even when systems feel under control, they continue to demand attention from leaders at the end of the day.

The Work That Quietly Takes Over the Week

When respondents broke down how they actually spend their time at work, more than one-third of the average leadership workweek was consumed by tool coordination and troubleshooting combined. That’s a substantial share of time devoted to keeping systems aligned, moving information between platforms, and resolving issues — work that supports productivity without advancing leadership priorities.

Meanwhile, core leadership activities like strategic planning, innovation, and people development account for barely half of the week. These are the activities most closely tied to leadership, growth, and long-term impact, yet they often compete for leftover time rather than being protected priorities.

This imbalance helps explain why many leaders feel constantly busy but rarely ahead. The issue isn’t effort or engagement. It’s that too much energy is spent maintaining the infrastructure leaders rely on to manage teams.

Focus Is Fragile in a Tool-Heavy Environment

Software doesn’t just consume time directly. It also disrupts it.

More than half of respondents say software or tool issues derail their focus sometimes or more often. These interruptions aren’t rare breakdowns or exceptional failures. They’re routine moments — think small glitches, sync issues, or workarounds — that repeatedly pull attention away from the task at hand.

Academic research also points to the cost of fragmented attention in modern work. Studies from Stanford University suggest that frequent task-switching and system interruptions make it harder to sustain focus and complex thinking. As work becomes more digitally mediated, the cumulative impact of small interruptions can quietly reshape how time and attention are spent.

Over the course of a day or week, this fragmentation adds up. Even manageable systems can make it harder to sustain deep thinking, strategic planning, or meaningful one-on-one conversations. Leadership focus becomes reactive rather than intentional.

A set of graphics showing data on what happens when tool complexity is reduced.

Buddy Punch

What Leadership Loses First

To understand how leadership is reshaped when tools demand more attention, respondents were asked to identify up to three areas of their work most negatively affected by time spent managing or troubleshooting software.

The losses show up most clearly at the top of the value chain. Innovation, strategy, and problem-solving take the biggest hit, with nearly half of respondents saying tool overhead directly undermines the work that drives improvement and direction. These are the activities that shape where teams are going next, but they’re often the first to be squeezed.

Only 1 in 10 respondents say their higher-value work is untouched. For everyone else, software demands actively crowd out coaching, culture-building, and client focus. Over time, this shift changes what leadership looks like in practice, even if job titles stay the same.

What Leaders Would Do With Time Back

When asked how they would reallocate time if software and tool demands were reduced, leaders showed remarkable alignment.

Most say they would spend that time on strategic planning, goal setting, innovation, and process improvement. Rather than filling reclaimed hours with more administrative work, they envision reinvesting in activities that strengthen organizations over time.

A large share would also redirect that time toward people-facing work. Roughly half would prioritize coaching and mentoring, while more than 4 in 10 would focus on deeper customer or client engagement. In other words, time saved from tools wouldn’t vanish. It would flow back into leadership, relationships, and trust-building.

And when leaders imagine where reclaimed time would go, the appeal of simplification becomes obvious. Reducing tool overhead isn’t just about efficiency — it’s about restoring capacity for the work that drives teams forward through leadership.

Why Simplifying Tools Feels So Impactful

The pressure to simplify isn’t happening in a vacuum. As new technologies are layered onto already complex systems, the cost of fragmentation has intensified. Research cited by Harvard Business Review and others suggests that leaders are being asked to manage “automated chaos” when organizations add tools faster than they redesign workflows or clarify how work should happen. The result is more activity, more output, and more interruptions without a corresponding increase in clarity, focus, or effectiveness.

Against that backdrop, it’s not surprising that leaders expect broad gains if their organizations simplify or consolidate their tools. Most anticipate higher morale, faster decision-making, and more time available for strategic leadership. Nearly half also expect better visibility into team performance, fewer tech-related delays, easier onboarding and training, and lower costs. Tool simplification is seen not as a narrow IT fix but as a lever that affects how leaders operate day to day.

These expectations rise sharply for companies that use more tools. Leaders at organizations using six or more tools are far more likely than those using just two or three to anticipate improvements across morale, speed, leadership capacity, performance visibility, and onboarding if their environments were streamlined.

This pattern suggests that as tool ecosystems grow more complex, the friction they create becomes more noticeable and more costly. At that point, consolidation feels less like optimization and more like relief.

A table listing qualities that both tools and leadership demand.

Buddy Punch

Rethinking the Trade-off Between Tools and Time

The key takeaway here isn’t that most leaders are failing at technology. It’s that many have quietly normalized how much time their systems demand and stopped questioning whether that tradeoff still makes sense.

When tools feel manageable, it’s easy to assume the problem is solved. But the real opportunity lies in stepping back and asking different questions: Where does coordination happen? Which systems require the most hand-offs? Where are leaders spending time maintaining workflows instead of guiding teams?

For many organizations, the next step isn’t adding another platform or rolling out new features. It’s simplifying what already exists. Reducing overlap. Clarifying ownership. Aligning tools more intentionally with how work actually happens.

This doesn’t require eliminating technology or rebuilding processes from scratch. Even small changes like consolidating platforms, standardizing workflows, or making tool decisions with time impact in mind can free up meaningful capacity. Capacity that can be redirected toward leadership, strategy, and people development.

Most importantly, leaders should treat time as a first-order design constraint, not a side effect. Tools should protect focus, reduce friction, and make it easier for leaders to lead.

The real advantage won’t come from managing software more efficiently. It will come from creating systems that demand less management in the first place.

Methodology

This survey was conducted with 534 U.S.-based adults aged 18 or over who are currently employed full-time or part-time as a small business owner, operations manager, leader, or another management professional with operations responsibilities. All respondents had been with their current organization for at least three months; were actively involved in operations management, people management, and oversight or use of work tools or software; and worked at organizations that use at least two tools or software platforms to manage day-to-day work. The survey was fielded online from Aug. 19 to Sept.3, 2025. Results reflect descriptive statistics with no weighting applied.

This story was produced by Buddy Punch and reviewed and distributed by Stacker.

Topics:

Careers & Education
Entertainment

Is K-pop music bad for your mental health? The answer might surprise you

Is K-pop music bad for your mental health? The answer might surprise you
By Jordan Parmenter, MA, LPC, NCC for LifeStance Health
4 min read • Originally published January 28, 2026 / Updated March 19, 2026
By Jordan Parmenter, MA, LPC, NCC for LifeStance Health
4 min read • Originally published January 28, 2026 / Updated March 19, 2026

A crowd of fans holding their phones up and cheering outside the Crypto.com Arena for a K-Pop concert in Los Angeles, California.

Sam the Leigh // Shutterstock

Is K-pop music bad for your mental health? The answer might surprise you

K-pop has taken the world by storm, captivating millions with its choreography, polished visuals and global fandoms. But as the industry continues to expand, one question has started to surface: Is K-pop bad for your mental health?

The answer isn’t simple. K-pop can both nurture and challenge emotional well-being. For many, it offers joy, belonging and healing. For others, it can create unrealistic expectations or emotional burnout. LifeStance Health reports on what research and real-world experience reveal about how K-pop shapes mental health.

K-pop, identity and representation

K-pop’s influence extends far beyond entertainment. For many multicultural and diaspora individuals, especially those of Korean heritage, it has become a meaningful way to reconnect with identity, family and culture.

Groups like BTS and Seventeen often weave themes of self-acceptance and authenticity into their lyrics, encouraging fans to embrace individuality rather than conformity. For those who have felt distant from their heritage or like they’re “not enough,” this kind of validation may heal old wounds, empower them to celebrate their unique backgrounds and express their true selves with confidence and pride.

In this way, K-pop can serve as both cultural expression and emotional affirmation, helping offer a space where listeners feel seen and understood.

How K-pop music affects the brain and emotions

Music is one of the most powerful emotional regulators we have. Neuroscience shows that listening to music activates the brain’s reward centers, releasing dopamine and boosting mood.

K-pop amplifies that effect through its emotional storytelling. Albums such as BTS’s “Love Yourself” trilogy explore heartbreak, self-love and resilience, which are often universal experiences that mirror therapeutic themes of healing and growth.

For many fans, engaging with this kind of music becomes a form of emotional processing. It helps them connect with their feelings, cultivate empathy and strengthen emotional awareness.

The power of K-pop fandom and belonging

K-pop fandoms like BTS’s ARMY or Seventeen’s CARATs are more than fan clubs. They are international communities where people find friendship, connection and purpose.

A 2021 study published in Psychological Reports found that K-pop fanship significantly predicted greater happiness, self-esteem and social connectedness across 92 countries. These findings may highlight a key truth: Social belonging is one of the strongest protective factors against anxiety and depression.

This study continues to show that K-pop offers potential emotional health benefits for some individuals when balanced with self-awareness:

  • Potentially boost happiness and self-esteem through social identity and belonging
  • Helps reduce stress and anxiety through dopamine release and emotional regulation
  • Promotes resilience and empathy via storytelling and authentic lyrics
  • Fosters cross-cultural understanding that can broaden perspective and connection

During the COVID-19 pandemic, many fans reported that K-pop communities helped them feel more hopeful and less isolated. For many, fandom became a lifeline during a time of global uncertainty.

How K-pop can harm mental health

Despite its benefits, K-pop is not without risks. The same forces that inspire connection can also lead to comparison, perfectionism and emotional exhaustion.

The industry’s intense pressure on idols (considered trained entertainers in K-pop culture) to maintain flawless appearances and performance standards has been widely reported in outlets like The Korea Herald and Medium. These unrealistic expectations can lead to anxiety, burnout or even disordered eating among performers.

Fans may internalize these ideals as well. Constant exposure to perfect visuals can distort self-image, leading to body dissatisfaction or obsessive admiration. In extreme cases, this can result in “fandom burnout,” where emotional well-being becomes dependent on idol validation or social media engagement.

Impact of K-pop on body image: Separating inspiration from comparison

The visual perfection in K-pop can be a double-edged sword. On one hand, fans admire idols’ discipline, artistry and confidence. On the other, constant exposure to idealized beauty standards can intensify insecurities about appearance.

Some K-pop artists have started speaking more openly about body image and mental health, promoting authenticity and self-compassion. For fans, embracing these messages means learning to enjoy K-pop as inspiration, not as a mirror. Fandom may support well-being when it empowers rather than pressures.

Health fandom vs. obsession

Being a fan isn’t usually the problem; it’s often how a fan engages that matters. Healthy fandom means setting emotional boundaries, consuming media mindfully and remembering that idols are human beings. It also means recognizing when constant updates, online debates or comparisons start to feel overwhelming and taking breaks to focus on real-life connections and self-care.

When approached with moderation, K-pop can enhance mood, build community and inspire personal growth. When taken to extremes, it can do the opposite.

The bottom line: Is K-pop bad for your mental health?

K-pop is not universally good or bad for mental health; its impact often depends on individual engagement and context. For many, it provides connection, creativity and healing. For others, it can become overwhelming when perfectionism, comparison or obsession take over.

K-pop reflects both the beauty and complexity of human emotion: Our desire for belonging, our pursuit of excellence and our ongoing struggle to balance authenticity with expectation.

Ultimately, K-pop can remind us that joy, creativity and compassion (whether through music, community or therapy) can all be powerful tools for emotional healing.

This story was published by LifeStance Health and reviewed and distributed by Stacker.

Topics:

Entertainment
Entertainment

Are these the 6 most iconic Super Bowl halftime shows?

Are these the 6 most iconic Super Bowl halftime shows?
By Christian Hardy for PrizePicks
6 min read • Originally published February 2, 2026 / Updated March 19, 2026
By Christian Hardy for PrizePicks
6 min read • Originally published February 2, 2026 / Updated March 19, 2026

Prince on stage during the 'Pepsi Halftime Show' at Super Bowl XLI on February 4, 2007 at the Dolphin Stadium in Florida.

Jonathan Daniel // Getty Images

Are these the 6 most iconic Super Bowl halftime shows?

Rain pouring down while Prince ripped an iconic guitar solo. Lady Gaga dropping in from the roof at NRG Stadium. Bruce Springsteen sliding across the stage.

These are some of the moments that have made Super Bowl halftime shows much more than just a break in the game. With world-class performers taking the stage every year, the Super Bowl halftime show has created lasting cultural memories.

As Super Bowl 60 approaches, fans are already speculating about what comes next: Bad Bunny’s opening song, potential surprise guests, and the visual moments that could define the night.

In recent years, that anticipation has become part of the Super Bowl experience, with fans engaging long before halftime — from predicting the songs that will be played to guessing cameos. Before the 2026 halftime show is added to the list, PrizePicks highlights six great Super Bowl halftime shows to commemorate Super Bowl 60.

These iconic Super Bowl halftime shows were chosen based on live execution, cultural impact, replay value, stage presence, and cameos.

Paul McCartney

Super Bowl XXXIX, Feb. 6, 2005

Halftime Score: Patriots 14, Eagles 7

Set List

  • “Drive My Car” – The Beatles
  • “Get Back” – The Beatles
  • “Live and Let Die” – Wings
  • “Hey Jude” – The Beatles

Cameos: None

Final Score: Patriots 24, Eagles 21

Paul McCartney’s halftime performance stood out for its simplicity and flawless execution — a needed reset one year after the infamous Janet Jackson incident. McCartney was the perfect performer as the NFL intentionally shifted toward a stripped-down approach to the show.

McCartney is one of the most consistent live performers in rock history and has the uncanny ability to connect with listeners of all generations. All generations love singing along with “Hey Jude.”

The image of tens of thousands of fans singing along in unison was one of the earliest — and clearest — examples of how shared can create a lasting halftime show memory.

Dr. Dre’s Hip-Hop Extravaganza

Super Bowl LVI, Feb. 13, 2022

Halftime Score: Rams 13, Bengals 10

Set List

  • “The Next Episode” – Dr. Dre, Snoop Dogg
  • “California Love” – Dr. Dre, Snoop Dogg
  • “In Da Club” – 50 Cent
  • “Family Affair” – Mary J. Blige
  • “No More Drama” – Mary J. Blige
  • “M.A.A.D City” – Kendrick Lamar
  • “Alright” – Kendrick Lamar ft. Pharrell
  • “Forgot About Dre” – Eminem (with Kendrick Lamar)
  • “Lose Yourself” – Eminem (with Anderson .Paak on drums)
  • “Still D.R.E.” – Dr. Dre, Snoop Dogg, Eminem, Mary J. Blige, 50 Cent, Kendrick Lamar

Cameos: Snoop Dogg, Eminem, Mary J. Blige, Kendrick Lamar, 50 Cent, Anderson .Paak

Final Score: Rams 23, Bengals 20

The Super Bowl LVI halftime show from SoFi Stadium in Inglewood, California, headlined by Dr. Dre, marked the first time that hip-hop fully took the stage — and it didn’t disappoint. Alongside Dre — the legendary producer — there were plenty of surprise cameos from his collaborators: Snoop Dogg, Eminem, Mary J. Blige, Kendrick Lamar, and an unforgettable 50 Cent scene.

Who better than Dr. Dre to bring together the era-defining tracks like “Lose Yourself” — with its unforgettable guitar riff — the driving bassline of “California Love” and “Alright,” the timely anthem from Los Angeles’ own?

There wasn’t a dull moment in this performance, signaling hip-hop’s long-overdue recognition within American pop culture, on the nation’s biggest stage.

The sheer number of collaborators and surprise appearances from this performance helped normalize cameo speculation as part of the Super Bowl experience.

Bruce Springsteen and The E Street Band

Super Bowl XLIII, Feb. 1, 2009

Halftime Score: Steelers 17, Cardinals 7

Set List

  • “Tenth Avenue Freeze-Out”
  • “Born to Run”
  • “Working on a Dream”
  • “Glory Days”

Cameos: None

Final Score: Steelers 27, Cardinals 23

Bruce Springsteen and The E Street Band took the halftime stage during what would become one of the greatest Super Bowls of all-time, sandwiched between James Harrison’s 100-yard interception touchdown and an unforgettable photo finish.

Springsteen set the tone in the opening seconds with The Slide — a full-speed, knees-first dive across the stage that instantly matched the energy of the game unfolding.

This was the kind of halftime show that amplified the moment, with hits like “Born to Run” and “Glory Days” cementing the legacy of this halftime performance.

Rolling Stones

Super Bowl XL, Feb. 5, 2006

Halftime Score: Steelers 14, Seahawks 3

Set List

  • “Start Me Up”
  • “Rough Justice”
  • “(I Can’t Get No) Satisfaction”

Cameos: None

Final Score: Steelers 21, Seahawks 10

If you think McCartney knows how to hold a crowd, meet the Glimmer Twins. Once Mick Jagger and Keith Richards opened with “Start Me Up” and got the crowd going, they had already salvaged what was a relatively boring Super Bowl.

Jagger’s nonstop movements and Richards’ guitar work sparked a fiery outing, with rock-and-roll energy oozing through America’s televisions.

The moment that stuck was the slow build into “(I Can’t Get No) Satisfaction,” as the band’s impressive catalog alone carried the show. Rather than feeling like a legacy act cameo, the performance rocked because it leaned fully into the Stones’ legendary ability to command a stadium.

Lady Gaga

Super Bowl LI, Feb. 5, 2017

Halftime Score: Falcons 21, Patriots 3

Set List

  • “God Bless America / This Land Is Your Land” (pre-recorded)
  • “Poker Face”
  • “Born This Way”
  • “Telephone”
  • “Just Dance”
  • “Million Reasons”
  • “Bad Romance”

Cameos: None

Final Score: Patriots 34, Falcons 28 (OT)

For Springsteen, it was The Slide. For Lady Gaga, it was The Jump.

While crooning a sincere homage to this country of mine to start, Gaga kicked off her outing by diving off the NRG Stadium roof, setting the tone for a visually striking masterpiece.

That was followed by a rapid-fire through the pop icon’s biggest hits; Gaga blew through six of her classics in a well-rehearsed, well-choreographed show.

The combination of scale, execution, hits, and sheer replay value made this halftime performance feel instantly iconic — just like the 25-point second-half comeback that accompanied it.

Prince

Super Bowl XLI, Feb. 4, 2007

Halftime Score: Colts 16, Bears 14

Set List

  • “Let’s Go Crazy”
  • “Baby I’m a Star”
  • “Proud Mary”
  • “All Along the Watchtower”
  • “Best of You” (Foo Fighters Cover)
  • “Purple Rain”

Cameos: The New Power Generation (band), The Twinz (dancers), Florida A&M Marching 100 Band

Final Score: Colts 29, Bears 17

Prince’s Super Bowl halftime show has become the standard by which every performance has been measured since. Fans got career-defining originals, unexpected covers, and a build toward an iconic closing stretch, featuring a guitar solo during “Purple Rain” — performed as rain poured down.

The combination of live musicianship, visual timing, and stage command — as is expected by The Purple One — is why this performance is often cited as the greatest Super Bowl halftime show of all-time.

Even if Prince’s halftime show isn’t at the top of your list, one thing is for sure: That is the stuff that Super Bowl halftime legend is made of.

The Super Bowl Halftime Show Starts Before Kickoff

From sing-alongs in Super Bowl parties across America, to surprise cameo appearances, to rain-soaked guitar solos, the greatest Super Bowl halftime shows share one common thread: They create moments that people remember long after the game ends.

As Super Bowl LX approaches, Bad Bunny will look to write his own halftime chapter. And as history has shown, fans won’t just be watching — they’ll be debating first songs, surprise guests, and defining moments ahead of kickoff.

This story was produced by PrizePicks and reviewed and distributed by Stacker.

Topics:

Entertainment
Careers & Education

Students’ skills and interest in science tumble in first post-COVID-19 test

Students’ skills and interest in science tumble in first post-COVID-19 test
By Linda Jacobson for The 74
7 min read • Originally published February 3, 2026 / Updated March 19, 2026
By Linda Jacobson for The 74
7 min read • Originally published February 3, 2026 / Updated March 19, 2026

High school students working with microscopes in a laboratory.

Ground Picture // Shutterstock

Students’ skills and interest in science tumble in first post-COVID-19 test

U.S. eighth graders are less prepared to be the scientists of tomorrow than they were before the pandemic.

In the first nationwide test of students’ science knowledge since 2019, the percentage of students scoring at the proficient level fell to 29%, down from 33%, and the average score dropped back to levels last seen in 2009, when a new version of the test was introduced, according to the National Assessment of Educational Progress.

An infographic with survey results showing that students are significantly less interested in science and less motivated to do well in the subject than they were five years ago.

National Center for Education Statistics

Students’ confidence in the subject area has also slipped, with 28% saying they “definitely can do various science-related activities,” down from 34%.

Performance fell across all three categories — physical, life, and earth and space sciences. Less than half of students can identify the major component of living cells, compared to 55% in 2019, and the percentage of students who can identify a characteristic of mammals declined from 72% to 68%.

It’s not just the decline in skills that concerns science experts; it’s the dramatic decrease in their interest. The share of students saying they enjoy science activities plummeted from 52% to 42%.

“If you’re not interested, it’s hard to learn,” said Christine Cunningham, senior vice president of STEM learning at the Museum of Science in Boston and a member of the National Assessment Governing Board, which sets policy for NAEP. Students were also less likely than in 2019 to say they engage in tasks like designing research questions, debating scientific ideas and conducting experiments to explain why something happens. “As someone who works a lot with students or with teachers who do that kind of inquiry, that’s why students get excited,” Cunningham told The 74.

Christine Cunningham, a STEM learning expert and member of the National Assessment Governing Board, said lessons focused on inquiry are what make students excited about science.

Courtesy of Christine Cunningham

COVID-era school closures derailed student learning in all areas, but science was hit especially hard as teachers tried to keep kids on track in reading and math. A 2022 report from the Public Policy Institute of California showed that only about a quarter of districts emphasized science in their recovery efforts. Teachers were more likely to assign free online lessons and let students work at their own pace, compared with a typical school year. Widespread declines in reading performance have also hampered students’ ability to keep up in science at a time when technology is rapidly evolving.

“Science is such a hands-on experience, and trying to find ways to bring that to different homes was challenging,” said Autumn Rivera, a sixth grade science teacher in Glenwood Springs, Colorado, west of Denver. “Eleven- and 12-year-olds really need a lot of activity.”

She got families involved in “kitchen chemistry,” asked students to dissect a flower and recorded videos of lessons to discuss with students on Zoom. One of their favorite experiments was studying the water cycle by hanging a plastic bag full of water in a sunny window.

In the spring of 2021, according to assessment company NWEA, students had missed out on at least two months of science learning. By 2024, science achievement in third to fifth grade had returned to 2019 levels, but seventh and eighth graders, across all racial groups, saw the most significant declines and were still more than three months behind pre-pandemic performance.

One former education secretary warned against using COVID “as an excuse.” Margaret Spellings, who led the department during George W. Bush’s administration, noted that, as with students’ achievement in other subject areas, performance in science did not improve between 2015 and 2019. Average scores for eighth and 12th graders were flat and declined for fourth graders.

A positive trend, Cunningham said, is that more elementary schools have added STEM as part of an elective rotation with art and music. Those classes can be highly engaging, but aren’t always focused on grade-level standards, she said. In addition, regular classroom teachers might scale back science lessons and focus more on reading and math.

High and low performers

The declines in achievement were not confined to a few student groups. They affected students whether or not they live in the suburbs, come from wealthier homes or have parents who graduated from college. Students without disabilities and who speak English as a first language also scored lower than in 2019.

But Matt Soldner, acting NCES commissioner, pointed out what he considers the one encouraging sign from the results — a 6-point increase in scores for English learners.

“NAEP describes the what, not the why,” he said, “but that’s an interesting subgroup finding.”

As with other NAEP assessments, the science results show a widening gap between students scoring at the highest and lowest levels. Scores for students in the 90th percentile dropped from 196 to 194, but fell further, from 106 to 101, for students at the 10th percentile. In fact, for students at both the 10th and 25th percentiles, scores are at “historic lows,” said Soldner. “These results should galvanize all of us to take concerted focused action to accelerate student learning.”

Julia Rafal-Baer, co-founder of ILO Group, an education consulting firm, and also a member of the governing board, said access to books likely contributes to the disparities in scores. If science wasn’t a high priority in some schools, “how is it that high-performing kids are still absorbing enough to be able to be high-performing?” she asked.

Many students, Rivera said, lack the reading skills to interpret science texts.

“I’m having to take a step back and really focus on basic reading … which is not something that I am technically trained in as a sixth grade teacher,” she said. Like many teachers, she also sees families place less emphasis on consistent attendance and good work habits. “We’re seeing students missing work. We’re not really seeing … emphasis placed on school or on achievement.”

Poor basic math skills are also hindering students’ progress in science, said Cunningham, who designs STEM curriculum materials for schools across the country.

Colorado science teacher Autumn Rivera with students collecting specimens near a creek.

Courtesy of Autumn Rivera

“Teachers are spending more time making sure that the kids are prepared to do some of the things that in the past they may have assumed kids would come equipped to do,” she said. “Could they make a table? Could they make a graph?”

On NAEP, the percentage of students saying they frequently “used tables or graphs to identify relationships between variables” fell from 43% to 39%. Less than a third “used math equations to explain or support scientific conclusions.”

‘Starving ourselves of knowledge’

NAEP will assess students’ reading and math skills again in 2026, but the next science assessment won’t take place until 2028, again just for eighth grade. Students will take a redesigned test that includes a stronger emphasis on students applying their knowledge and will incorporate more technology and engineering topics.

Because so many students — at least a third — score below basic, Cunningham added that the board felt it was important to expand the number of questions targeting students at that level.

“We need to know more about what that population knows,” she said. The questions, for example, might be simpler and require less reading.

Fourth graders were left out of the 2024 and 2028 science tests for budget reasons, Cunningham said. They’re scheduled to participate again in 2032. But one former governing board member said the absence of data from fourth graders is troubling.

“If there had to be a cut, I understand why we would, but it still raises the question of what we expect in science in early grades,” said Andrew Ho, a testing expert and education professor at Harvard University. “Why are we starving ourselves of knowledge about educational progress outside of [English language arts and math]?”

Staff cuts to NCES delayed the release of the results, which were expected earlier this summer.

During a background call with reporters last week, a member of the governing board said the results were “an opportunity for the field to see that these report cards are of the same quality that they have come to expect from the NAEP program.” But an NCES official on the same call said that in light of Education Secretary Linda McMahon firing most of the center’s employees, the department will need “sufficient staff and other resources in place” to conduct the tests next year and plan for 2028.

McMahon reiterated her support for the NAEP program during a recent interview.

“If we have an objective measure across all states, like NAEP, then I think that’s the best way to go,” she said. “We will not get away from having NAEP scores and the research that we can all rely on to make sure that we’re doing the right things.”

‘AI-driven world’

Beverly DeVore-Wedding, president of the National Science Teaching Association, still worries that the “current political climate” will diminish the program.

“I am concerned about them changing the assessment picture and that NAEP could get reduced to only reading and mathematics,” she said.

The science results also have implications for other aspects of President Donald Trump’s agenda, such as incorporating artificial intelligence into learning. Last week, first lady Melania Trump hosted an event tied to the president’s challenge for students to use AI to address community challenges.

“It’s not one of those things to be afraid of,” McMahon said at the event. “Let’s embrace it. Let’s develop AI-based solutions to real-world problems.”

Rafal-Baer said the rapid adoption of AI tools just reinforces the importance of science education.

“AI is here and it’s already reshaping how we work, learn and solve problems,” she said. “The complexity is only going to accelerate, and we can’t afford to have a scientifically illiterate workforce trying to navigate an AI-driven world.”

This story was produced by The 74 and reviewed and distributed by Stacker.

Topics:

Careers & Education

Posts navigation

Older posts
Newer posts
Featured Jobs
Kirkus Media
Editorial Intern
Kirkus Media
New York City, New York (US)

Gaia Inc
MEDIA COORDINATOR
Gaia Inc
Louisville, CO

Gaia Inc
Global Paid Media Specialist
Gaia Inc
Louisville, CO

Gaia Inc
Director of Media Strategy
Gaia Inc
Louisville, CO

Hearst Television
Account Executive
Hearst Television
Milwaukee, WI, United States

All Jobs »
PREMIUM MEMBER

Kenneth Miller

Los Angeles, CA
26 Years Experience
A versatile, artful and award-winning journalist, I've reported from four continents for national magazines. Specialties include human interest,...
View Full Profile »
Join Mediabistro Membership Today

Stand out from the crowd with a premium profile

Mediabistro Logo Find your next media job or showcase your creative talent
  • Job Search
  • Hot Jobs
  • Membership
  • Newsletter
  • Career Advice
  • Media News
  • Hiring Tips
  • Creative Tools
  • About
Facebook YouTube Instagram LinkedIn
Copyright © 2026 Mediabistro
  • Terms of Use
  • Terms of Service
  • Privacy