The Verification Layer Is Cracking. Who Pays to Fix It?
Fact-checkers face lawsuits. Fake bylines multiply. Advertisers reveal what they'll still pay for. Three threads, one problem.
By
Mediabistro Team
5 min read • Published May 14, 2026
By
Mediabistro Team
5 min read • Published May 14, 2026
The infrastructure that validates what’s true in media is getting squeezed from every direction. A federal lawsuit filed by fact-checkers and academic researchers argues that government policies targeting misinformation work could chill free speech and make verification harder.
Same structural problem: the mechanisms that establish credibility in journalism are under pressure from legal challenges, technological workarounds, and economic forces all at once.
Publishers need verification systems to maintain audience trust. Those systems cost money and staff time. And now they face potential legal liability for operating them at all.
Three Connected Threads: How verification systems themselves are becoming contested terrain. How political communication has turned fact-checking into a treadmill that outruns the fact-checkers. And where advertisers are still placing premium dollars, revealing what media formats command genuine attention.
The coalition wants a federal judge to block enforcement. The case matters because it could set a precedent for whether verification work itself carries liability. That’s a line we haven’t crossed before.
Legal environments make fact-checking riskier. AI-generated or pseudonymous bylines make attribution unreliable. Credibility erodes from both ends.
Verification costs scale poorly. Every article with a contested source requires editorial investigation. Every potential legal challenge requires counsel. The economics push toward less verification, precisely when the market needs the opposite.
Freelancers and staff writers feel this downstream. When publications can’t confidently verify sources or defend fact-checking decisions, editors get more conservative about assignments and kill stories that carry any whiff of legal exposure. The work contracts even as the need for it expands.
The Fact-Check Treadmill
Political communication now generates content faster than verification can process it. A recent exchange between reporters and President Trump turned into a ready-made attack ad within hours. Press conference to political messaging to news cycle coverage, all recursive, with fact-checking becoming part of the story being fact-checked.
The ivermectin cycle shows how this works at scale. A new hantavirus outbreak triggered public health alarms, and the same false claims about ivermectin that circulated during COVID reattached themselves to the new crisis. Fact-checkers found themselves republishing identical debunks with different disease names. Doctors confirmed there is no proven cure for hantavirus.
This is a structural trap. Political actors know false claims spread faster than corrections. They know fact-checks become news stories that extend the reach of the original claim. Each new crisis offers a fresh hook to recycle tested misinformation.
For reporters covering politics, basic reporting gets harder. Sources float claims, generate coverage, force fact-checks, then cite the fact-checks as evidence of bias. The verification process itself becomes weaponized. You can’t opt out without abandoning accountability. Participating creates professional risk and audience fatigue.
What Advertisers Will Still Pay For
Two radically different stories answer the same question: where do advertisers see value they trust enough to spend against?
Disney’s upfront presentation made the Super Bowl and live events the centerpiece of its pitch. The real draw was the promise of unskippable, simultaneous audience attention. Live events deliver what programmatic inventory can’t: verified human eyeballs at scale, in real time, with emotional investment that drives recall.
At the opposite end, the Staffordshire Signal is covering costs through local print advertising. The nonprofit magazine launched to counter what its founders call “clickbait negativity” and is on track to pay staff £45,000 per year. It works because local advertisers trust the attention is real and the audience is present.
The Pattern: Advertisers pay for attention they can verify. Live events prove presence through simultaneity. Hyperlocal print proves it through geographic specificity. The common thread is trust in the delivery mechanism.
Career implications: Live events production, sports broadcasting, and local news operations all show revenue resilience because they deliver verifiable attention. Roles that exist purely in programmatic environments face more volatility, as ad money follows credibility.
What This Means
Publishers are splitting into two camps: those doubling down on verification infrastructure despite rising costs and legal risk, and those quietly retreating from fact-checking and byline accountability to reduce exposure. The middle ground is shrinking fast.
For media professionals, this is a sorting mechanism. Outlets investing in verification need editors, researchers, and reporters who can navigate legal complexity and defend editorial decisions. Outlets abandoning verification need content producers who can generate volume without triggering review. Watch which direction your employer is moving. It tells you what skills matter for advancement and which roles survive cuts.
The advertising patterns reinforce this. Building a career around live events, local coverage, or formats that deliver verifiable attention means positioning for revenue stability. If your role depends on high-volume programmatic inventory with weak audience verification, the pressure runs toward commodification and automation.
The verification layer is cracking. The question is who pays to fix it, and what kind of media ecosystem emerges from the split between institutions that invest and those that don’t.
If you’re navigating this environment, browse open roles on Mediabistro and track which employers are hiring for verification work versus content volume. The job postings tell you which bet they’re making.
For employers building teams, reporters and editors who can operate in legally complex verification environments are scarce and getting more expensive. Post a job on Mediabistro to reach candidates who understand these dynamics.
This media news roundup is automatically curated to keep our community up to date on interesting happenings in the creative, media, and publishing professions. It may contain factual errors and should be read for general and informational purposes only. Please refer to the original source of each news item for specific inquiries.
How 2026 AMA Artist of the Year nominees rank by platform data
By
Kristian Gorenc for Viberate
5 min read • Published May 14, 2026
By
Kristian Gorenc for Viberate
5 min read • Published May 14, 2026
Kevin Mazur // Getty Images
How 2026 AMA Artist of the Year nominees rank by platform data
The American Music Awards arrive each year with the scale of a pop spectacle: arena lights, red-carpet moments, televised performances, and some of the largest fanbases in music watching closely. But behind the public excitement is a simple question that follows every major awards show: Which artist had the strongest year?
For the AMAs, the official answer comes from fans. The awards are built around public voting, and the 2026 Artist of the Year race brings together 10 acts with major global audiences: Bad Bunny, Bruno Mars, BTS, Harry Styles, Justin Bieber, Kendrick Lamar, Lady Gaga, Morgan Wallen, Sabrina Carpenter, and Taylor Swift.
Music data offers a different way to look at the field. It cannot measure every factor that drives fan voting, including loyalty, campaign timing, and organized voting. But it can show which nominees are strongest across measurable audience activity, including streaming, video consumption, playlist reach, radio airplay, and social audience growth.
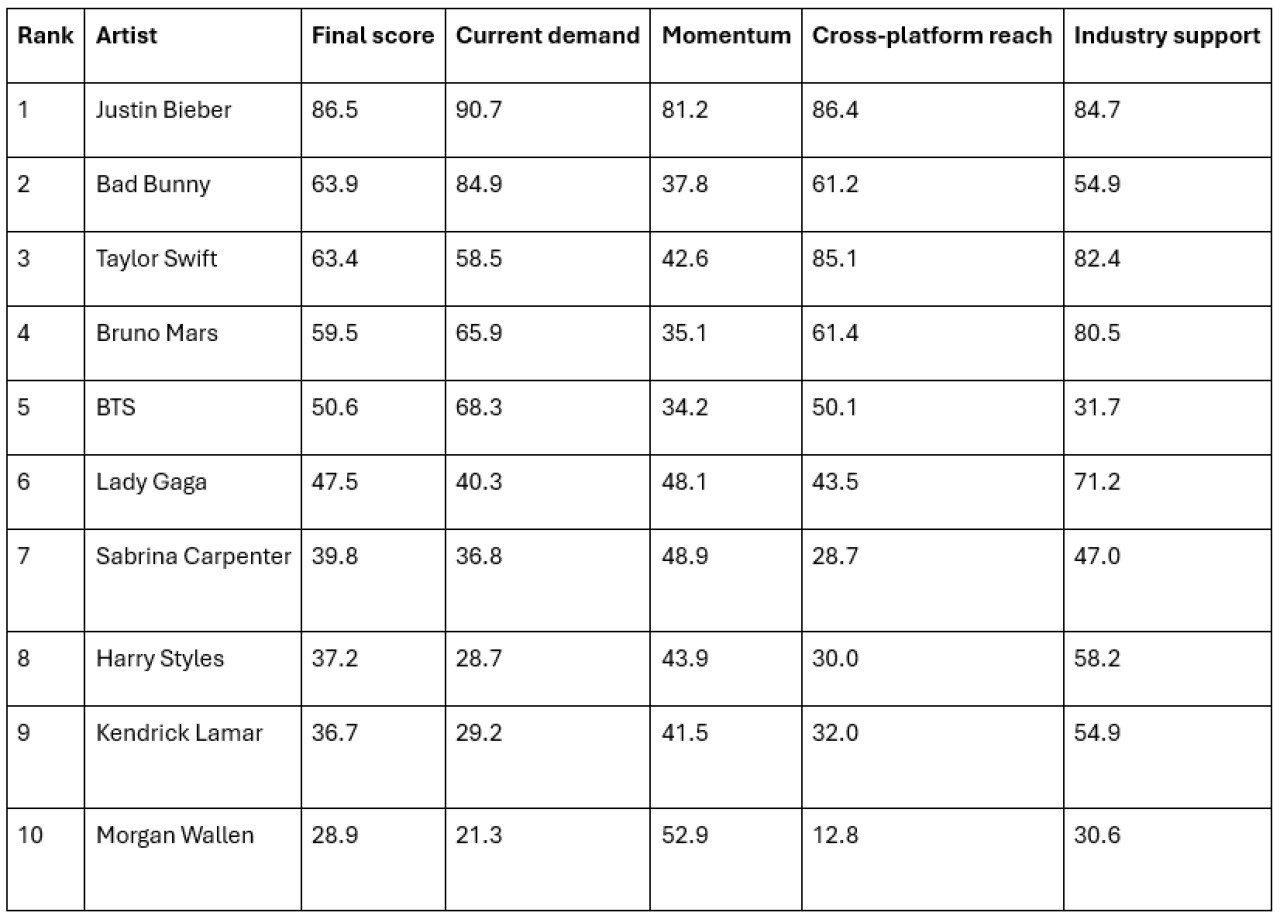
Using artist-level music analytics data exported from Viberate, the analysis compared the 10 Artist of the Year nominees across four areas: current demand, momentum, cross-platform reach, and industry support. Based on that model, Justin Bieber would rank first if the category were decided only by measurable platform data.
Bieber did not rank first in every individual category. Bad Bunny had the strongest recent consumption profile across Spotify streams and YouTube views. Bruno Mars had the largest current Spotify monthly-listener base. Taylor Swift posted the strongest radio result. BTS had the highest top-10 Spotify track demand.
Bieber’s advantage came from balance. He ranked near the top in recent Spotify and YouTube activity, while also showing the strongest audience growth signals across Spotify monthly listeners, YouTube subscribers, and Instagram followers. He also had the highest Spotify playlist reach among the nominees.
Data-only ranking of 2026 Artist of the Year nominees
Courtesy of Viberate
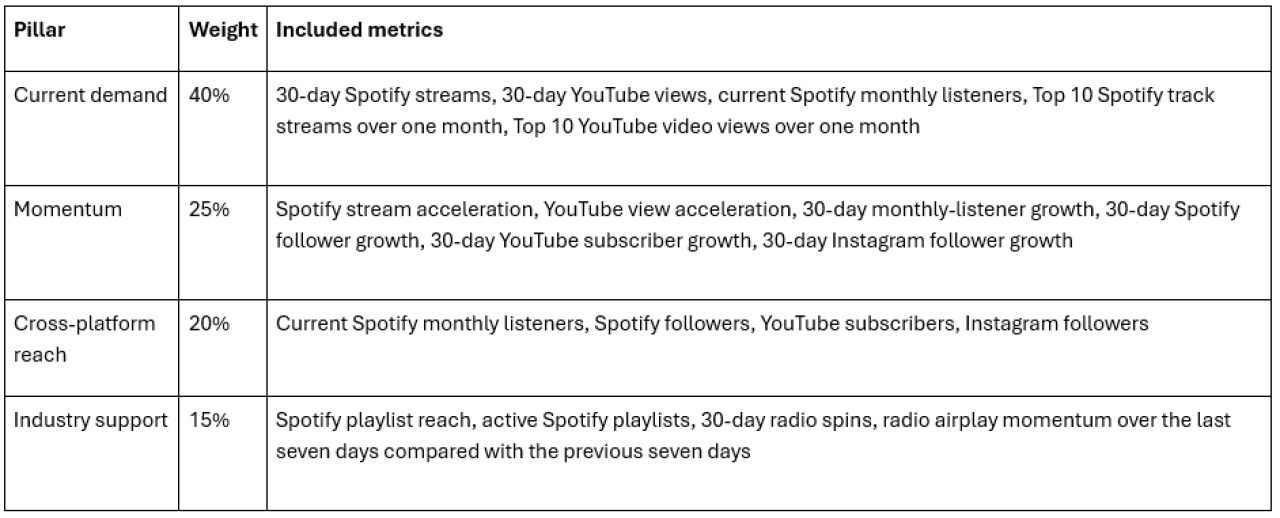
The final score combines four weighted pillars. Current demand accounted for 40% of the total, momentum for 25%, cross-platform reach for 20%, and industry support for 15%.
The ranking shows a clear difference between scale and all-around performance. Bad Bunny finished second largely because of his strength in current demand. His recent Spotify and YouTube activity placed him at the top of the field in consumption, but the broader model also considered whether audience activity was rising or slowing during the analysis window.
Taylor Swift finished third, less than a point behind Bad Bunny. Her strongest areas were reach and industry support, helped by large audience totals, strong playlist positioning, and the top radio score among the nominees. Her lower YouTube demand and weaker recent listener movement kept her behind Bieber and Bad Bunny in the combined ranking.
Bruno Mars ranked fourth. His strongest signal was audience scale, especially on Spotify, where he had the largest current monthly-listener base among the nominees. He also performed strongly in playlisting, but lower momentum kept him outside the top three.
BTS ranked fifth despite having the strongest top-10 Spotify track total in the model. That distinction matters: track-level strength can be high even when the broader artist profile is weaker across reach, radio, playlisting, or momentum.
Lady Gaga, Sabrina Carpenter, Harry Styles, Kendrick Lamar, and Morgan Wallen filled out the second half of the ranking. Several of those artists had strong individual signals, especially in momentum or industry support, but none matched Bieber’s cross-category consistency.
The main takeaway is not that one artist controlled every platform. The data shows a more mixed field. Bad Bunny had the strongest consumption case. Taylor Swift had the strongest radio case. Bruno Mars had the strongest current Spotify listener case. BTS had the strongest top-10 Spotify track case. Bieber ranked first because he combined high current activity with the strongest growth and playlist-reach signals in the overall model.
That makes the Artist of the Year field less one-sided than a simple ranking might suggest. Different nominees led different parts of the music economy, from streaming consumption to radio activity to playlist exposure. In a fan-voted award, those differences may play out in ways data alone cannot capture. But as a measurement of recent, cross-platform performance, the model points to Bieber as the strongest all-around candidate in the field.
Methodology
The analysis used artist-level data exported from Viberate, a music analytics service, for the 10 American Music Awards 2026 Artist of the Year nominees. The exports included metrics related to Spotify, YouTube, Instagram, Spotify playlisting, and radio airplay.
The artists analyzed were Bad Bunny, Bruno Mars, BTS, Harry Styles, Justin Bieber, Kendrick Lamar, Lady Gaga, Morgan Wallen, Sabrina Carpenter, and Taylor Swift.
The available daily data covered Jan. 27-April 28, 2026. The main comparison window was the 30-day period ending April 28, 2026, using March 29 as the baseline date for 30-day change calculations. Short-term momentum compared the last seven days ending April 28 with the prior seven-day period.
The final score used four weighted pillars:
Courtesy of Viberate
Scale metrics were normalized against the top-performing nominee, with the leader in each metric receiving 100 points. Growth and acceleration metrics were min-max normalized, so the strongest growth result received 100 points and the weakest received 0 points. This approach reduced distortion from artists whose audience counts declined during the period.
All growth metrics were calculated from total values rather than exported daily change fields. TikTok was excluded from the main score because not every nominee had comparable TikTok data. Instagram was used only for followers and follower growth because engagement fields were not consistently available. YouTube official-channel view changes and YouTube like changes were excluded because those fields were not suitable for consistent daily momentum scoring.
Collaborations were included when the nominated artist appeared in the exported artist field. The same rule was applied to all artists for Spotify tracks and YouTube videos.
No tie-breaker was needed because there were no tied final scores.
The Mediabistro editorial team draws on 25 years of media industry expertise to cover jobs, careers, and trends shaping the industry.
4 min read • Published May 14, 2026
Scaling Operations Are Driving Today’s Most Interesting Hires
Several of today’s standout listings share a common thread: organizations in active growth mode looking for people who can build systems, not just fill seats. Crooked Lane Books wants to increase its commercial fiction acquisitions by 50%. A Chicago nonprofit is expanding to new cities and needs the marketing infrastructure to support it. The Council on Foreign Relations is investing in video storytelling for brand and social channels.
These aren’t maintenance roles. Each one asks candidates to architect something, whether that’s a publishing pipeline, a content engine, or a video production workflow. The compensation reflects it too, with posted salaries reaching into six figures for the right experience. If your resume shows measurable results from building or scaling a program, today’s market is rewarding that skill set.
One more pattern worth flagging: mission-driven organizations continue to dominate the Mediabistro board. Policy groups, cultural institutions, and purpose-led publishers are competing for the same digital and content talent that used to flow exclusively to agencies and tech companies. The leverage has shifted.
Today’s Hot Jobs
Head of Content Strategy, Commercial Fiction at Crooked Lane Books / Alcove Press
Why this role is rare: Independent publishers almost never post a role explicitly designed to scale acquisitions volume by a specific percentage. Crooked Lane is asking this hire to own the entire acquisitions pipeline, from trend spotting and agent outreach through negotiations and contracts, with the autonomy to approve or decline titles. The hybrid/remote flexibility and the Penguin Random House distribution backbone make this an unusual combination of indie speed and major-publisher reach.
What the listing asks for:
5-8 years of experience, ideally in commercial fiction publishing
Demonstrated ability to manage a high-velocity acquisitions pipeline
Data-backed approach to editorial strategy and buying criteria
Comfort leading and prioritizing the work of an 11+ person editorial team
Brand and Growth Marketing Content Manager at Open Heart Magic
What makes this compelling: This Chicago-based nonprofit is mid-rebrand (from Open Heart Magic to “Bring Magic to Kids in Hospitals”) and expanding nationally after reaching 8,400 hospitalized children last year. The hire will build and run the organization’s content and marketing systems from the ground up. The listing is refreshingly specific about what “build” means here: email campaigns, social strategy, community growth metrics, and storytelling that drives donor engagement. At $70,000 with a hybrid schedule, the role offers meaningful creative ownership for someone with three to five years of marketing experience.
The core requirements:
Experience building and running content and marketing systems that produce measurable results
Strong skills in email marketing, social media management, and brand storytelling
Ability to work hybrid from Chicago
Comfort operating as the primary marketing function during a growth phase
The signal here: CFR is a 104-year-old policy institution, and the fact that it’s hiring a dedicated video producer focused on brand marketing content, sizzle reels, and short-form social video tells you something about where even the most traditional organizations are investing. This isn’t a “shoot our panel discussions” gig. The listing specifically calls for motion graphics fluency, social-native storytelling chops, and a portfolio that proves both. Washington, DC-based candidates with foreign policy or institutional media experience will have an edge. If you’re looking to sharpen your social media presence while job hunting, Mediabistro’s guide on how writers and creatives can use social media to boost their personal brands is worth a read.
Key qualifications:
Demonstrated experience writing, producing, and editing video across multiple formats
Strong hands-on video editing and motion graphics production skills
Portfolio reflecting deep familiarity with social video formats and brand storytelling
Available to work on-site in Washington, DC at least three days per week (moving to four days in September 2026)
Director of Digital and Social Media at TransLash Media
The opportunity in context: TransLash is an award-winning, multi-platform media organization producing podcasts, films, journalism, and community content. This director-level role reports directly to the CEO and carries real strategic authority over how the organization shows up across every digital channel. The $135,000-$155,000 salary range is notably strong for a mission-driven media outlet, and the position is fully remote. Candidates who can bridge high-level platform strategy with hands-on content execution will stand out.
What they need:
Strategic leadership experience across social media and digital platforms
Ability to operate at both strategic and day-to-day execution levels
Experience growing and engaging audiences for a media or content organization
Comfort translating complex social issues into compelling, platform-native content
Today’s strongest listings reward builders over maintainers. If you’ve launched a content program, scaled a team’s output, or created systems where none existed before, make that the centerpiece of your application materials. Quantify it. “I built X from scratch” or “I grew Y by Z percent” carries more weight right now than a long list of platforms you’ve touched. Organizations in growth mode are hiring for evidence of initiative, and they’re paying accordingly. The roles offering the most creative freedom and the best compensation are the ones that need someone to construct the roadmap, not just follow one.
Reservoir Media to Release Fourth Quarter and Fiscal Year 2026 Results on May 28, 2026
By
Media News
2 min read • Published May 14, 2026
By
Media News
2 min read • Published May 14, 2026
NEW YORK, NY / ACCESS Newswire / May 14, 2026 / Reservoir Media, Inc. (NASDAQ:RSVR) ("Reservoir" or the "Company"), an award-winning independent music company, today announced that it will release financial results for the fourth fiscal quarter and fiscal year 2026 ended March 31, 2026, before market open on Thursday, May 28, 2026.
Reservoir will host a conference call to discuss its results at 10 a.m. Eastern Daylight Time on the same day. A live audio webcast of Reservoir’s fourth quarter and full year results discussion will be accessible under the Events and Presentations section of the Company’s Investor Relations website at https://investors.reservoir-media.com/news-and-events/events-and-presentations. An archived version of the Company’s webcast will also be available on Reservoir’s website.
Interested parties may also participate in the call using the registration link here. Once registered, participants will receive a webcast link to enter the event. Alternatively, participants may dial into the call using the following phone number: +1 201-389-0921 (Toll-free: 877-407-0989).
To access the call, please log in approximately 10 minutes before the start of the call.
ABOUT RESERVOIR
Reservoir is an independent music company based in New York City and with offices in Los Angeles, Nashville, Toronto, London, Abu Dhabi, and Mumbai. Reservoir is the first female-founded and led publicly traded independent music company in the U.S. Founded as a family-owned music publisher in 2007, Reservoir represents copyrights and master recordings including titles dating as far back as 1900 and hundreds of #1 releases worldwide. Reservoir frequently holds a Top 10 U.S. Market Share according to Billboard’s Publishers Quarterly, was twice named Publisher of the Year by Music Business Worldwide’s The A&R Awards and won Independent Publisher of the Year at the 2020 and 2022 Music Week Awards.
Reservoir also represents a multitude of recorded music through Chrysalis Records, Tommy Boy Music, and Philly Groove Records and manages artists through its ventures with Blue Raincoat Music and Big Life Management.
AI is disrupting hiring: How tech talent can stand out
By
Matthew Campbell-Miller for Toptal
4 min read • Published May 13, 2026
By
Matthew Campbell-Miller for Toptal
4 min read • Published May 13, 2026
Summit Art Creations // Shutterstock
AI is disrupting hiring: How tech talent can stand out
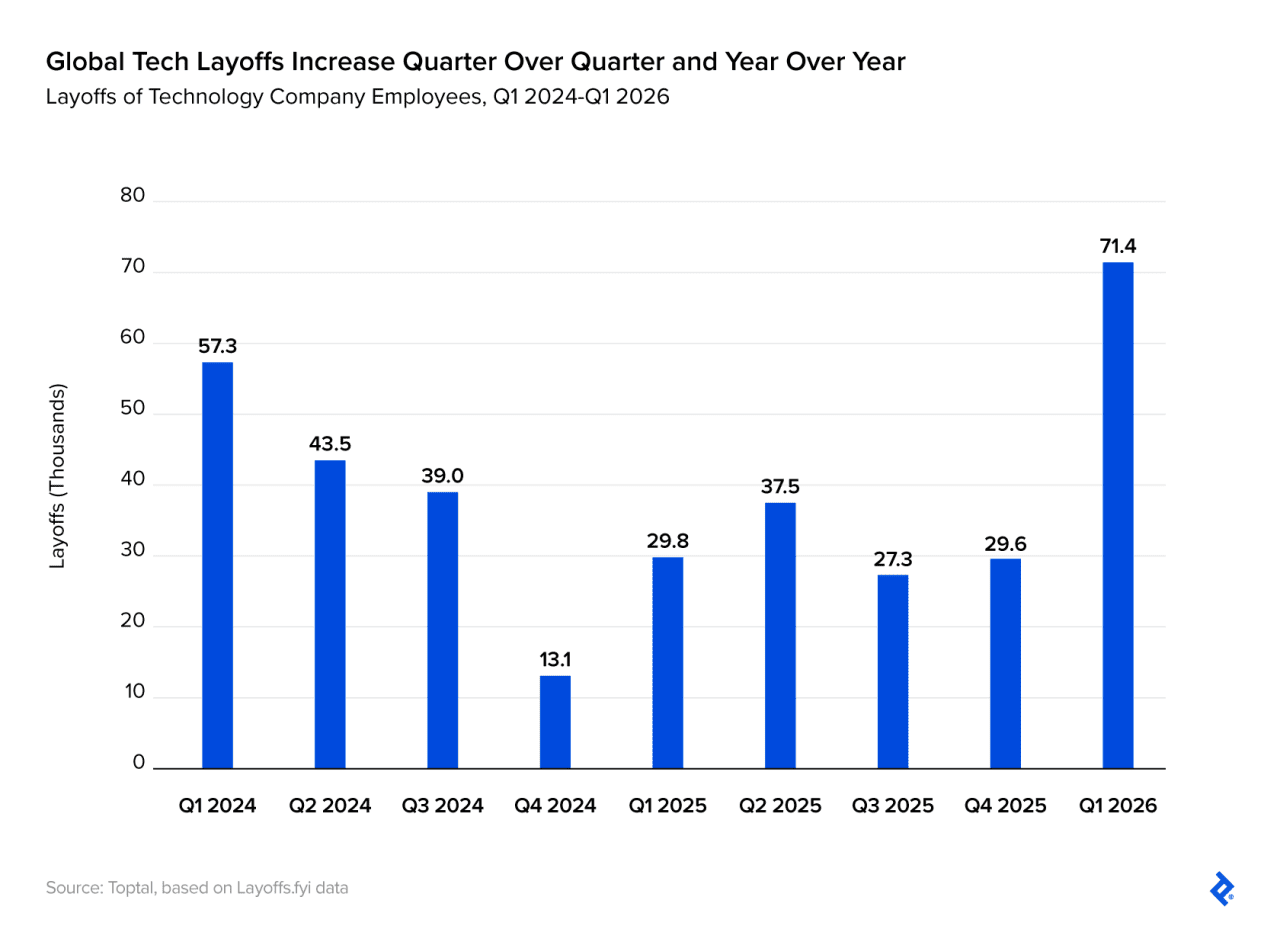
Layoffs continue to ripple across the technology sector, while companies simultaneously accelerate AI integration, investing heavily in new tools and infrastructure. AI accounted for 25% of all job cuts in March 2026 and 8% of all cuts in Q1.
Toptal’s High-skilled Job Report for Q1 2026 finds that technology company layoffs have surged by roughly 140% quarter over quarter (QoQ) and year over year (YoY), underscoring the scale of disruption occurring alongside continued investment in AI.
Beneath the surface, however, the report suggests that demand for experienced technology and professional services roles is increasing even as overall job opportunities continue to decline.
The report’s methodology draws on data from Layoffs.fyi, Indeed, and Lightcast, as well as qualitative insights from Toptal executives about what they are seeing in the marketplace. For job seekers and employers alike, understanding the drivers behind this shift is crucial for landing jobs and building teams. This article examines those drivers and distills insights for companies and workers.
Toptal
The New Baseline: Fewer Roles, Higher Expectations
As AI automates tech and operational tasks, many employers are looking for professionals who can operate at a higher level from day one. Engineers who understand how to build, manage, and collaborate with AI systems rather than simply write code. Product managers who make sure that AI initiatives deliver measurable business value. Data specialists who help organizations design, train, and govern AI models.
This translates to more opportunities for senior workers. Demand for technology and professional services personnel with at least five years of experience increased by 10.5% QoQ and 6.4% YoY, according to Toptal’s report.
There is also a clear shift in how companies evaluate candidates. Formal job titles are becoming less important than demonstrable AI-related skills. Hiring managers care less about traditional credentials and increasingly want to see how candidates apply their knowledge in real-world situations: Portfolios, open-source contributions, freelance work, and hands-on project experience are the modern differentiators.
For job seekers, this shift from credential-based hiring to capability-based hiring requires them to show evidence of the work they are applying to do, such as building an AI-powered application or securing cloud environments. Doing so offers a significant advantage, even for those without a traditional career trajectory.
The report suggests that although demand has slowed for some skill sets and grown for others, organizations are shifting from volume hiring to leaner teams of versatile senior professionals who pair deep domain expertise with AI fluency, business acumen, and cross-functional agility. Organizations that successfully integrate AI into their workflows tend to treat automation as a tool that amplifies human expertise rather than replacing it. In that environment, professionals who understand both the technology itself and how to apply AI tools to improve efficiency and solve complex problems have a clear advantage.
Why Companies Are Looking for Talent Everywhere
Employers now face the challenge of not only redefining the talent they need but also finding it. Specialized talent remains difficult to source, with roles that require technical depth and experience with AI systems the most challenging.
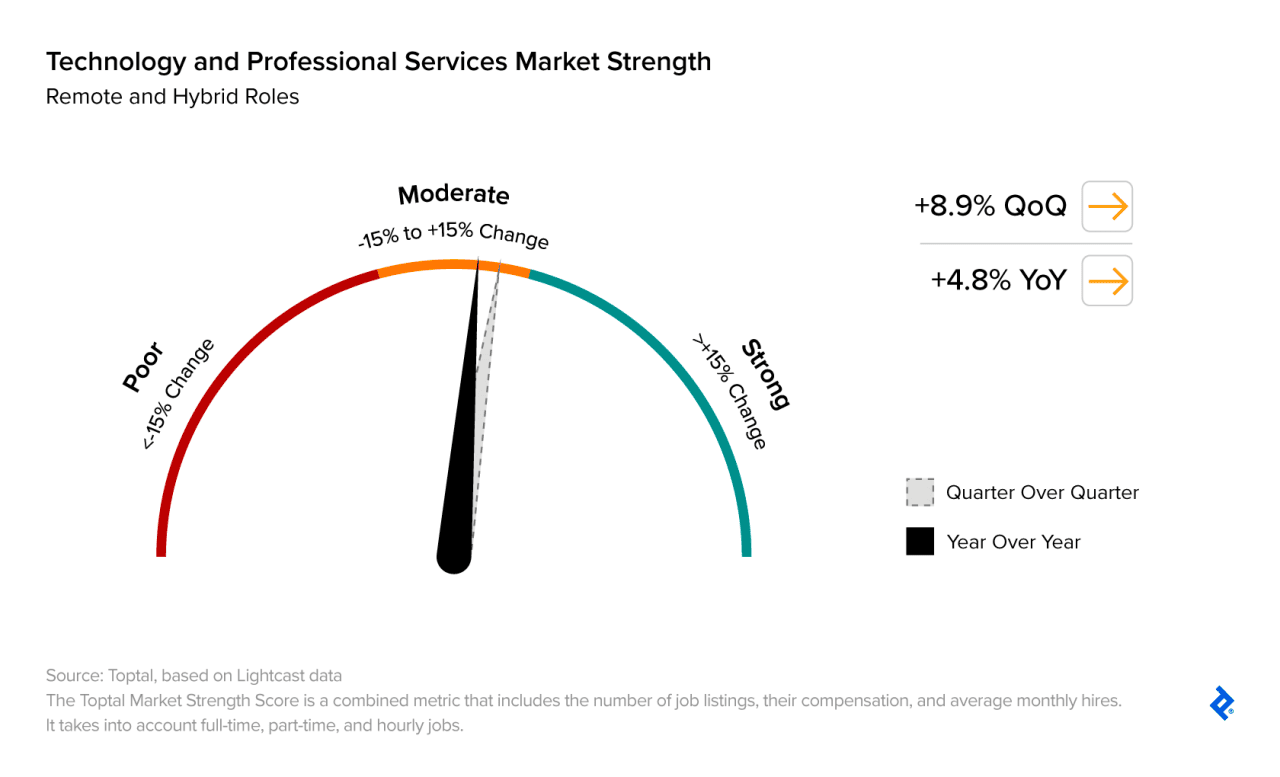
Many organizations are expanding their recruiting strategies beyond traditional geographical boundaries. Rather than competing for a limited number of candidates in major tech hubs, companies are leaning into remote hiring and distributed teams to expand talent pools. A Datapeople study found that remote job postings increase the candidate pool by 125%.
Toptal’s report suggests that this shift isn’t just a response to talent shortages; it’s an emerging structural feature of the labor market. Postings for remote and hybrid roles in the technology and professional services sector rose 8.9% QoQ and 4.8% YoY, in Q1.
Toptal
The geographic shift means job seekers are no longer limited to local opportunities. High-skilled workers now have access to roles with companies worldwide, particularly in fields where expertise remains scarce.
But access alone isn’t enough. Candidates must align their skills with demand. The report points to AI systems, cybersecurity, and data engineering as particularly strong opportunities in fields that are actively hiring despite broader market uncertainty. While the report found that overall U.S. job growth is projected to decline moderately through Q2 2026, demand for experienced remote and hybrid technology and professional services roles is expected to increase, albeit at a slower pace than in previous years.
That means building skills that go beyond traditional expectations: developing hands-on experience with AI tools, working across the full life cycle of systems, and demonstrating the ability to apply technical knowledge to real business problems.
Adaptability Is the New Core Skill
For job seekers navigating today’s volatile market, the message is simple: Opportunities exist for highly skilled, specialized roles, but they require a new mix of capabilities. For companies, the challenge is building effective teams in an increasingly AI-driven environment where specialized talent is both in high demand and limited supply. For workers, it means developing the skills needed to take on work that is more complex and AI-integrated than ever before.
As a result, adaptability has become the most valuable asset. Companies and workers who can evolve with emerging technologies will continue to have an advantage, while those who cannot will find fewer opportunities in a market that is becoming more selective and more specialized.
INEO Announces Patented INEO Welcoming DUO in Full Production with First Installation Underway in Leading UK Retailer
By
Media News
4 min read • Published May 13, 2026
By
Media News
4 min read • Published May 13, 2026
SURREY, BC / ACCESS Newswire / May 13, 2026 / INEO Tech Corp. (TSX-V:INEO)(OTCQB:INEOF) (the "Company" or "INEO") announces that its patented INEO Welcoming DUO system is now in full production, with the first production unit being installed this week at a UK retail location.
The INEO Welcoming DUO is the Company’s entrance pedestal featuring a digital display screen on both sides. The system combines Electronic Article Surveillance ("EAS") detection capability, dual-sided digital media display and platform connectivity in a format designed to increase media capacity while maintaining a footprint similar to traditional loss prevention entrance systems.
Management believes the DUO is an important extension of INEO’s product offering. By providing retailers with digital display inventory on both sides of the pedestal from substantially the same entrance footprint, the DUO is designed to create additional media capacity and increase the utility of the store entrance. Management also believes this may support broader deployment opportunities for INEO’s subscription-based platform and connectivity services as retailers look to derive more value from entrance infrastructure.
The system is also designed to meet or exceed the detection range of most standard EAS systems. Management believes this reflects INEO’s engineering capability in integrating theft protection, digital display and industrial design in a system configuration which many in the industry had viewed as difficult to achieve.
"The Welcoming DUO shows that retailers do not have to choose between detection performance, aesthetics and media capacity," said Kyle Hall, CEO of INEO. "We believe they can have all three in a system designed for a real retail environment."
Like INEO’s other connected systems, the Welcoming DUO is supported by the Company’s subscription-based INEO Connectivity Package. The Connectivity Package includes Dashboard access, continuous system health monitoring, remote maintenance and support tools, software and security updates, reporting, user administration and media management and integration functionality intended to support the ongoing operation of the installed system while providing retail media revenue to the retailer.
The Company expects to provide further updates as additional product, customer and partner milestones are reached.
INEO Tech Corp.
Per: "Kyle Hall" Kyle Hall, Chief Executive Officer and Director
About INEO Tech Corp. (TSX-V:INEO)(OTCQB:INEOF)
INEO Tech Corp. builds technology at the intersection of in-store retail media and loss prevention. INEO’s patented integration of Electronic Article Surveillance (EAS) pedestals with digital displays helps retailers reduce theft while generating incremental retail media revenue from the same footprint. INEO is headquartered in Surrey, British Columbia, Canada, and is publicly traded on the TSX Venture Exchange (INEO) and the OTCQB (INEOF).
About Sensormatic Solutions Sensormatic Solutions, the leading global retail solutions portfolio of Johnson Controls, powers safe, secure and seamless retail experiences. For more than 60 years, the brand has been at the forefront of the industry’s fast-moving technology adoption, redefining retail operations on a global scale and turning insights into actions. Sensormatic Solutions delivers an interconnected ecosystem of loss prevention, inventory intelligence and traffic insight solutions, along with our services and partners to enable retailers worldwide to innovate and elevate with precision, connecting data-driven outcomes that shape retail’s future. Please visit Sensormatic Solutions or follow us on LinkedIn, X, and our YouTube channel.
Forward-Looking Statements
This news release contains forward-looking information, which involves known and unknown risks, uncertainties and other factors that may cause actual events to differ materially from current expectations. Important factors – including the availability of funds, acceptance of the Company’s products, competition, and general market conditions – that could cause actual results to differ materially from the Company’s expectations are disclosed in the Company’s documents filed on SEDAR, including the MD&A for the year ended June 30, 2025. Readers are cautioned not to place undue reliance on these forward-looking statements, which speak only as of the date of this press release. The Company disclaims any intention or obligation, except to the extent required by law, to update or revise any forward-looking statements, whether as a result of new information, future events or otherwise.
Neither the TSX Venture Exchange nor its Regulation Services Provider (as that term is defined in policies of the TSX Venture Exchange) accepts responsibility for the adequacy or accuracy of this release.
Cannes Hit Record Numbers. The Industry Showed Up Divided.
The world's biggest film market is booming, but AI protests, geopolitical friction, and a World Cup ad mess tell a more complicated story.
By
Mediabistro Team
5 min read • Published May 13, 2026
By
Mediabistro Team
5 min read • Published May 13, 2026
The Cannes Film Market closed registration for 2026 with 16,000 participants from more than 140 countries. Highest attendance in the market’s history.
Among the 40,000 industry professionals on the Croisette, the growth is most striking in Japan, which has emerged as a serious force in international film financing and acquisition. Variety’s full breakdown shows the U.S., France, and the UK holding their positions at the top, but Japan’s surge signals a geographical shift in where film investment capital is concentrating.
Record numbers suggest an industry in rude health. But on the same ground where those 16,000 participants are making deals, the Empty Red Carpet protest against generative AI has celebrities like Anya Taylor-Joy and Pedro Pascal conspicuously absent from the festival’s most iconic photo ops, replaced by visual voids that land harder than any picket line.
The festival is booming and fractured at the same time. That’s the film industry in 2026.
Three threads run through this year’s market: what the record numbers actually mean, what kinds of projects are finding commercial pathways, and how AI tensions on the Palais steps are manifesting in advertising’s biggest live test, the World Cup.
The Market Metrics Tell Two Stories
The 16,000 figure is real. Deadline’s attendance coverage notes this comes against what organizers are openly calling a “complex geopolitical backdrop,” which is festival-speak for trade tensions, content regulation disputes, and shifting alliances that make international co-productions harder than they were five years ago.
Japan’s growth matters because Japanese buyers and financiers are increasingly backing projects with international appeal rather than staying within domestic genre lanes. That changes the math for producers hunting gap financing or pre-sales.
While deal-makers fill the Palais, the Empty Red Carpet protest documented by Creative Bloq uses the festival’s most visible real estate to argue that generative AI represents an existential threat to creative labor. Photographers shoot empty staircases instead of A-listers. It works precisely because Cannes runs on images.
The Tension: Generative AI tools are already in use for pre-visualization, script coverage, and marketing asset creation by some of the same companies sending executives to Cannes to buy films made by human directors, writers, and crews. The record attendance and the AI protest aren’t contradictory. They’re two halves of an industry that hasn’t reconciled its economic imperatives with its cultural anxieties.
What’s Selling: Indies Find Traction
Past the protests and the participation metrics, the practical question: what’s actually finding buyers?
The Mise En Scene Company picked up world sales rights to “Dope Queens”, a feature from writer-director Grafton Doyle produced by Julio Lopez Velasquez. Classic Cannes sales trajectory: a completed or near-completed film secures representation, gets market screenings, and starts building a distribution footprint territory by territory. MSC actively acquiring signals confidence that buyer demand exists for mid-budget English-language projects with genre appeal.
On the prestige side, Sara Ishaq’s “The Station” is premiering in Critics’ Week, the sidebar that has launched directors who go on to competition slots in later years. Ishaq, whose documentary short “Karama Has No Walls” earned an Academy Award nomination, describes the film as revealing “the colors, the frankincense, the laughter and the singing” behind closed doors in a culture outsiders rarely see with nuance.
Different strategies, same thread: both are using Cannes as a launchpad into a fragmented distribution landscape. Independent producers and sales agents are betting that certain stories will find audiences through the festival-to-platform-to-theatrical hybrid model that has replaced the old indie playbook.
The World Cup Ad Cycle Is AI’s Biggest Live Test
If Cannes is where AI meets the film industry on the red carpet, the World Cup is where it meets advertising in the living room. The 2026 tournament has become a live laboratory for how audiences respond to AI-generated creative at massive scale.
Campaigns feature everyone from Lionel Messi to Timothée Chalamet to a digitally resurrected David Beckham. The AI Beckham spot is the most instructive case: brands are using generative tools to create versions of celebrities for markets where those celebrities don’t speak the language or wouldn’t naturally appear. Execution quality varies wildly.
The Pattern: AI-generated elements work when deployed as production tools within a human-led creative framework. They fail conspicuously when asked to carry conceptual weight. The best spots used AI for technical tasks like language dubbing or background compositing. The worst used it as a substitute for creative direction, resulting in work that feels algorithmically assembled rather than strategically crafted.
This matters beyond the tournament. Advertising is the industry where generative AI is being deployed fastest and with the highest financial stakes. Agencies are under pressure to cut production costs while maintaining creative output. But if audiences can spot AI-generated work and respond negatively, the cost savings are offset by reduced campaign effectiveness. The World Cup, with its global reach and intense real-time scrutiny, is producing data points that will shape how brands deploy AI creative for years.
The connection back to Cannes is direct. The Empty Red Carpet protest and the World Cup ad cycle are two expressions of the same underlying question: where does the line fall between AI as a production tool and AI as a replacement for human creative judgment?
What This Means
Cannes 2026 is an industry growing and splintering simultaneously. Japan’s emergence changes the geography of film finance in ways that will create openings for producers who know how to structure international co-productions. The deals on the Croisette will populate streaming platforms and arthouse theaters over the next 18 months.
The AI protest isn’t fringe. High-profile talent is saying the industry’s rush to adopt generative tools is happening without sufficient thought about long-term consequences for creative workers. The World Cup ad cycle is producing evidence that audiences can tell the difference between human-crafted and AI-generated creative.
For media professionals: watch where the money goes next. If Japan’s Cannes presence translates into a wave of co-productions with Japanese financing, that creates opportunities for producers, sales agents, and distribution executives who can navigate those relationships. If World Cup ad data shows AI creative underperforms, agencies will adjust their tooling strategies accordingly.
If you’re looking to move into film production, international sales, or advertising strategy, browse open roles on Mediabistro to see where demand is concentrating. If you’re hiring for positions that require navigating the tension between commercial imperatives and creative integrity, post a job on Mediabistro to reach candidates who understand the landscape.
Cannes doesn’t resolve these tensions. It just makes them visible at higher resolution.
This media news roundup is automatically curated to keep our community up to date on interesting happenings in the creative, media, and publishing professions. It may contain factual errors and should be read for general and informational purposes only. Please refer to the original source of each news item for specific inquiries.
Dolphin Entertainment Reports First Quarter 2026 Results
By
Media News
9 min read • Published May 12, 2026
By
Media News
9 min read • Published May 12, 2026
Q1’26 Revenue Rises 5.2% YoY to $12.8M
Reiterates Expectations for Continued Revenue Growth, Significant Free Cash Flow Generation, and Adjusted EBITDA Margin Expansion in 2026
MIAMI, FL / ACCESS Newswire / May 12, 2026 / Dolphin (NASDAQ:DLPN), a leading entertainment marketing and premium content production company, today announced its financial results for the first quarter ended March 31, 2026.
Bill O’Dowd, CEO of Dolphin, commented:
"While the first quarter is historically our lightest due to normal business seasonality, we are pleased to report continued top-line growth, with total revenue increasing 5.2% year over year to $12.8 million. Furthermore, we reduced our Adjusted EBITDA loss by 25% year-over-year. We emphasize Adjusted EBITDA because, given our significant non-cash amortization expenses and minimal capital expenditures, it is a much more accurate reflection of our true cash flow potential than operating income.
As noted in our prior quarter’s remarks, following several years of acquisitions and growth-related investment, Dolphin is now well positioned to realize the benefits of that work. We continue to operate in highly attractive sectors, and with rising profitability, modest capex requirements, and $127 million in NOL carryforwards, we remain confident in our ability to generate meaningful free cash flow in the periods ahead. Finally, with insiders holding a substantial stake in the company, management remains deeply aligned with shareholders in the pursuit of long-term value.
Looking ahead, we are excited about the rest of 2026, 2027, and beyond. In addition to organic improvements in our existing business, there are readily identifiable catalysts that should increase earnings even more. We are making progress with our DealMaker partnership, and we just announced a publishing imprint venture with Copper Books and Simon & Schuster that allows us to offer premium book publishing services to our clients with no upfront capital required from Dolphin. We would also remind investors that our bank debt matures in less than two and a half years, which will free up nearly $2.2 million in annual principal and interest payments. Looking a bit further out, we continue to anticipate roughly $1 million in annualized lease savings once our large New York City and Los Angeles leases expire in the second half of 2027. Given our NOLs, which substantially shield us from cash taxes, the bulk of these combined savings should flow directly to the bottom line, providing a further tailwind to free cash flow".
Q1 2026 and Recent Highlights
Total revenue for the three months ended March 31, 2026, was $12.8 million, an increase of 5.2% from $12.2 million last year.
Operating loss was $2.1 million for the three months ended March 31, 2026, compared to an operating loss of $1.8 million for the three months ended March 31, 2025.
Operating expenses for Q1 2026 were $14.9 million, including non-cash expenses of $0.5 million related to depreciation and amortization, a one-time non-recurring distribution guarantee of $0.7 million and legal and professional fees higher than usual due to litigation costs of approximately $0.2 million. This compares to operating expenses of $13.9 million in Q1 2025, including depreciation and amortization of $0.6 million and acquisition costs of approximately $0.4 million.
Net loss for Q1 2026 was $2.7 million as compared to a net loss of $2.3 million for Q1 2025.
Basic and diluted loss per share for Q1 2026 was $(0.22) based on 12,327,974 weighted average shares outstanding compared to basic and diluted loss per share in Q1 2025 of $(0.21) based on 11,162,026 weighted average shares outstanding.
Adjusted EBITDA loss for Q1 2026 of approximately $(467,000) improved by 25% compared to approximately $(625,000) in Q1 2025.
Dolphin
Subsidiary clients shaped the Summer 2026 season with culture-defining festivals and events
CEO was featured on Variety’s "Strictly Business" podcast and discussed the creator economy’s transformation of marketing and consumer product launches
Expanded Miami footprint to support continued growth across subsidiaries
Partnered with DealMaker to unlock community capital for celebrity and influencer brands
Powerhouse subsidiaries led major brand activations during Super Bowl LX
42West
Drove global film publicity at CinemaCon 2026
Delivered marquee talent and a standout film slate at the 2026 SXSW Festival, featuring a company-record 16 world premiere titles and three audience award-winners
Celebrated an Oscar win as "Mr. Nobody Against Putin" took Best Documentary Feature at the 98th Academy Awards
Clients presented, performed, and took home honors at the 2026 GRAMMY Awards (in partnership with Shore Fire Media)
Landed six nominations for clients at the 98th Academy Awards
Brought exciting and diverse projects to the 2026 Sundance Film Festival
Shore Fire Media
Client and Afrobeat pioneer Fela Kuti became the first African solo artist to be inducted into the Rock & Roll Hall of Fame
Clients earned 9 nominations for Independent Music’s top awards
Partnered with The Door on the launch of Pawn Shop, a new sports-driven hospitality concept
Clients presented, performed, and took home honors at the 2026 GRAMMY Awards (in partnership with 42West)
The Door
Partnered with Shore Fire Media on the launch of Pawn Shop, a new sports-driven hospitality concept
Launched a Miami hub, expanding Dolphin’s South Florida presence
DISRPT Agency, a division of The Door, powered "Art of Glam" during Oscars week, driving cultural momentum into Camille Rose’s upcoming Beauté Noir
Elle Communications
Client Harbor Fund announced Sundance Mountain Resort as the new long-term home of Harbor Film Forum
The Digital Dept.
Signed reality TV show stars, top beauty creators, and more
Youngblood
As hockey had a Hollywood moment, Dolphin’s adaptation of the cult classic Youngblood premiered in Los Angeles
Partnered with Vaneast Pictures to bring the sports drama Youngblood to Berlin for international sales
Official trailer and key art were released for Hubert Davis’ adaptation of the hockey classic "Youngblood"
Conference Call Information
To participate in this event, dial in approximately 5 to 10 minutes before the beginning of the call.
This press release contains ‘forward-looking statements’ within the meaning of the Private Securities Litigation Reform Act. These forward-looking statements may address, among other things, Dolphin Entertainment Inc.’s offering of common stock as well as expected financial and operational results and the related assumptions underlying its expected results. These forward-looking statements are distinguished by the use of words such as "will," "would," "anticipate," "expect," "believe," "designed," "plan," or "intend," the negative of these terms, and similar references to future periods. These views involve risks and uncertainties that are difficult to predict and, accordingly, Dolphin Entertainment’s actual results may differ materially from the results discussed in its forward-looking statements. Dolphin Entertainment’s forward-looking statements contained herein speak only as of the date of this press release. Factors or events Dolphin Entertainment cannot predict, including those described in the risk factors contained in its filings with the Securities and Exchange Commission, may cause its actual results to differ from those expressed in forward-looking statements. Although Dolphin Entertainment believes the expectations reflected in such forward-looking statements are based on reasonable assumptions, it can give no assurance that its expectations will be achieved, and Dolphin Entertainment undertakes no obligation to update publicly any forward-looking statements as a result of new information, future events, or otherwise, except as required by applicable law.
Dolphin (NASDAQ:DLPN) is where cultural creation meets marketing execution. Founded in 1996 by Bill O’Dowd, Dolphin operates as both a venture studio-developing and investing in breakthrough content, products, and experiences-and a marketing consortium, featuring leading agencies across every communications discipline.
At its core, the venture studio creates, produces, finances, markets, and promotes new businesses and cultural ideas – ranging from acclaimed film, television, and digital content to consumer goods, live events and partnerships that define entertainment and lifestyle. Surrounding this entrepreneurial engine, Dolphin’s marketing prowess brings together best-in-class firms including 42West, The Door, Shore Fire Media, Elle Communications, Special Projects and The Digital Dept. Together, this collective delivers unmatched cross-marketing expertise and relationships across every vertical of pop culture – from film, television, music, influencers, sports, hospitality, and fashion to consumer brands and purpose-driven initiatives. Dolphin marketing has been the recipient of many accolades, including #1 Agency of the Year on the Observer PR Power List in 2025, The PR Net 100, and the PR News Elite 120.
DOLPHIN ENTERTAINMENT, INC. AND SUBSIDIARIES CONDENSED CONSOLIDATED BALANCE SHEETS (Unaudited)
March 31, 2026
December 31, 2025
ASSETS
Current
Cash and cash equivalents
$
6,283,857
$
8,756,585
Restricted cash
925,004
925,004
Accounts receivable:
Trade, net of allowance of $449,279 and $1,327,808, respectively
6,952,004
7,848,970
Other receivables
4,384,663
5,243,931
Other current assets
1,201,594
1,179,498
Total current assets
19,747,122
23,953,988
Capitalized production costs, net
542,305
520,338
Employee receivable
1,228,085
1,196,085
Right-of-use assets
2,630,279
3,012,941
Goodwill
21,507,944
21,507,944
Intangible assets, net
7,375,731
7,898,607
Property, equipment and leasehold improvements, net
38,410
50,961
Other long-term assets
198,296
189,296
Total Assets
$
53,268,172
$
58,330,160
LIABILITIES
Current
Accounts payable
$
2,415,858
$
3,096,715
Term loans, current portion
1,852,548
1,813,760
Revolving line of credit
400,000
400,000
Notes payable, current portion
3,500,000
3,500,000
Convertible notes payable, current portion
1,550,000
1,250,000
Accrued interest – related party
2,163,116
2,043,087
Accrued compensation – related party
2,625,000
2,625,000
Lease liabilities, current portion
1,671,364
1,912,482
Deferred revenue
953,969
794,177
Other current liabilities
10,010,068
11,096,820
Total current liabilities
27,141,923
28,532,041
Noncurrent
Term loans, noncurrent portion
2,502,601
2,976,930
Notes payable, noncurrent portion
4,580,000
4,580,000
Convertible notes payable
5,900,000
6,460,000
Convertible notes payable- related party
2,839,556
2,904,357
Convertible notes payable at fair value
260,000
270,000
Loans from related party
983,112
983,112
Lease liabilities
1,271,028
1,469,386
Deferred tax liability
481,561
463,909
Total Liabilities
45,959,781
48,639,735
STOCKHOLDERS’ EQUITY
Preferred Stock, Series C, $0.001 par value, 50,000 shares authorized, 50,000 shares issued and outstanding at March 31, 2026 and December 31, 2025
1,000
1,000
Common stock, $0.015 par value, 200,000,000 shares authorized, 12,513,104 and 12,221,432 shares issued and outstanding at March 31, 2026 and December 31, 2025, respectively
187,697
183,321
Additional paid-in capital
159,114,925
158,809,301
Accumulated deficit
(151,995,231
)
(149,303,197
)
Total Stockholders’ Equity
7,308,391
9,690,425
Total Liabilities and Stockholders’ Equity
$
53,268,172
$
58,330,160
DOLPHIN ENTERTAINMENT, INC. AND SUBSIDIARIES CONDENSED CONSOLIDATED STATEMENTS OF OPERATIONS (unaudited)
Three Months Ended
March 31,
2026
2025
Revenues
$
12,803,937
$
12,169,711
Expenses:
Direct costs
784,650
344,414
Payroll and benefits
10,715,144
10,304,233
Selling, general and administrative
2,047,161
1,772,444
Depreciation and amortization
537,276
591,552
Acquisition cost
–
416,171
Legal and professional
856,138
514,424
Total expenses
14,940,369
13,943,238
Loss from operations
(2,136,432
)
(1,773,527
)
Other (expenses) income:
Change in fair value of convertible note
10,000
20,000
Interest expense, net
(547,950
)
(554,013
)
Total other (expenses) income, net
(537,950
)
(534,013
)
Loss before income taxes
(2,674,382
)
(2,307,540
)
Income tax expense
(17,652
)
(21,522
)
Net loss
$
(2,692,034
)
$
(2,329,062
)
Loss per share:
Basic
$
(0.22
)
$
(0.21
)
Diluted
$
(0.22
)
$
(0.21
)
Weighted average number of shares outstanding:
Basic
12,327,974
11,162,026
Diluted
12,327,974
11,162,026
Use of Non-GAAP Financial Measures
In order to provide greater transparency regarding our operating performance, the financial results in this press release refer to a non-GAAP financial measure that involves adjustments to GAAP results. Non-GAAP financial measures exclude certain income and/or expense items that management deems are not directly attributable to the Company’s core operating results and/or certain items that are inconsistent in amounts and frequency, making it difficult to perform a meaningful evaluation of our current or past operating performance.
Adjusted earnings before interest, taxes, depreciation and amortization ("Adjusted EBITDA") is defined by Dolphin as net (loss) or income adjusted for (i) interest, (ii) taxes, (iii) depreciation and amortization, (iv) acquisition costs, (v) change in fair value of convertible note, (vi) allowance for credit losses, (vii) litigation costs; (viii) other one-time or non-cash costs.
Management believes that the presentation of operating results using this non-GAAP financial measure provides useful supplemental information for investors by providing them with the non-GAAP financial measure used by management for financial and operational decision making, planning and forecasting and in managing the business. This non-GAAP financial measure does not replace the presentation of financial information in accordance with U.S. GAAP. These non-GAAP financial results should not be considered a measure of liquidity and is unlikely to be comparable to non-GAAP financial measures provided by other companies.
Reconciliation of GAAP net loss to non-GAAP Adjusted EBITDA loss
Climate change is driving rising temperatures and more record heat. The Earth’s temperature has climbed each decade since 1880 by about .14 degrees Fahrenheit, or roughly 2 degrees Fahrenheit total.
Stacker compiled a ranking of the hottest Mays in New York since 1895 using data from the National Centers for Environmental Information. Rankings are based on the highest average temperature in each month. For each of the hottest months listed below, we’ve included the average state temperature, state-wide highs and lows for the month, and the total precipitation.
#9. May 1975 (tie) – Average temperature: 59.6°F – Monthly high temperature: 72.2°F – Monthly low temperature: 47°F – Total precipitation: 3.15″
#9. May 1896 (tie) – Average temperature: 59.6°F – Monthly high temperature: 71°F – Monthly low temperature: 48.1°F – Total precipitation: 2.54″
#6. May 2024 (tie) – Average temperature: 60°F – Monthly high temperature: 70.9°F – Monthly low temperature: 49.2°F – Total precipitation: 3.53″
#6. May 2018 (tie) – Average temperature: 60°F – Monthly high temperature: 72.3°F – Monthly low temperature: 47.8°F – Total precipitation: 2.76″
#6. May 1991 (tie) – Average temperature: 60°F – Monthly high temperature: 72.2°F – Monthly low temperature: 47.8°F – Total precipitation: 3.21″
#5. May 1998 – Average temperature: 60.4°F – Monthly high temperature: 72°F – Monthly low temperature: 48.8°F – Total precipitation: 3.59″
#3. May 2012 (tie) – Average temperature: 60.5°F – Monthly high temperature: 72°F – Monthly low temperature: 49°F – Total precipitation: 4.12″
#3. May 1944 (tie) – Average temperature: 60.5°F – Monthly high temperature: 73.4°F – Monthly low temperature: 47.6°F – Total precipitation: 2.93″
#2. May 2015 – Average temperature: 61°F – Monthly high temperature: 74.2°F – Monthly low temperature: 47.8°F – Total precipitation: 2.75″
#1. May 1911 – Average temperature: 61.3°F – Monthly high temperature: 74.6°F – Monthly low temperature: 48°F – Total precipitation: 2.44″
Climate change is driving rising temperatures and more record heat. The Earth’s temperature has climbed each decade since 1880 by about .14 degrees Fahrenheit, or roughly 2 degrees Fahrenheit total.
Stacker compiled a ranking of the hottest Mays in California since 1895 using data from the National Centers for Environmental Information. Rankings are based on the highest average temperature in each month. For each of the hottest months listed below, we’ve included the average state temperature, state-wide highs and lows for the month, and the total precipitation.
#9. May 2020 (tie) – Average temperature: 64.6°F – Monthly high temperature: 78.4°F – Monthly low temperature: 50.9°F – Total precipitation: 1.2″
#9. May 2014 (tie) – Average temperature: 64.6°F – Monthly high temperature: 78.8°F – Monthly low temperature: 50.5°F – Total precipitation: 0.35″
#9. May 2006 (tie) – Average temperature: 64.6°F – Monthly high temperature: 78.5°F – Monthly low temperature: 50.7°F – Total precipitation: 0.73″
#9. May 1940 (tie) – Average temperature: 64.6°F – Monthly high temperature: 78.8°F – Monthly low temperature: 50.4°F – Total precipitation: 0.68″
#8. May 1924 – Average temperature: 64.9°F – Monthly high temperature: 80.2°F – Monthly low temperature: 49.5°F – Total precipitation: 0.07″
#7. May 1947 – Average temperature: 65°F – Monthly high temperature: 79.5°F – Monthly low temperature: 50.5°F – Total precipitation: 0.48″
#6. May 1984 – Average temperature: 65.3°F – Monthly high temperature: 79.8°F – Monthly low temperature: 50.7°F – Total precipitation: 0.39″
#5. May 1931 – Average temperature: 65.5°F – Monthly high temperature: 79.8°F – Monthly low temperature: 51.2°F – Total precipitation: 0.96″
#4. May 2009 – Average temperature: 66.7°F – Monthly high temperature: 80.6°F – Monthly low temperature: 52.7°F – Total precipitation: 1.24″
#3. May 1992 – Average temperature: 67°F – Monthly high temperature: 80.9°F – Monthly low temperature: 53°F – Total precipitation: 0.23″
#2. May 1997 – Average temperature: 67.6°F – Monthly high temperature: 81.8°F – Monthly low temperature: 53.3°F – Total precipitation: 0.38″
#1. May 2001 – Average temperature: 68.6°F – Monthly high temperature: 83.8°F – Monthly low temperature: 53.3°F – Total precipitation: 0.15″
I'm a marketing writer that writes search engine optimized copy and content. I have helped client's increase website traffic by as much as 70% in as...


